BELMANIP_00014


Location

lon / lat [deg]: -49.9576 / -22.5947

Source network: BELMANIP


Geostationary surface albedo (GSA) data


“+000”


“+057/+063”


Landcover information (based on ESA CCI landcover data)


Landcover fractions @ 2km distance


Landcover fractions @ 20 km distance


Legend


Distance to open water bodies [km]:

14.86

Distance to urban areas [km]:

20.89


Radius: 1 km

Number of landcover classes:

2

Dominant landcover type:

10: cropland, rainfed

Fraction of dominant landcover type [%]:

97.0


Radius: 2 km

Number of landcover classes:

2

Dominant landcover type:

10: cropland, rainfed

Fraction of dominant landcover type [%]:

97.0


Radius: 5 km

Number of landcover classes:

2

Dominant landcover type:

10: cropland, rainfed

Fraction of dominant landcover type [%]:

99.0


Radius: 10 km

Number of landcover classes:

1

Dominant landcover type:

10: cropland, rainfed

Fraction of dominant landcover type [%]:

100.0


Radius: 20 km

Number of landcover classes:

1

Dominant landcover type:

10: cropland, rainfed

Fraction of dominant landcover type [%]:

100.0


Disturbances


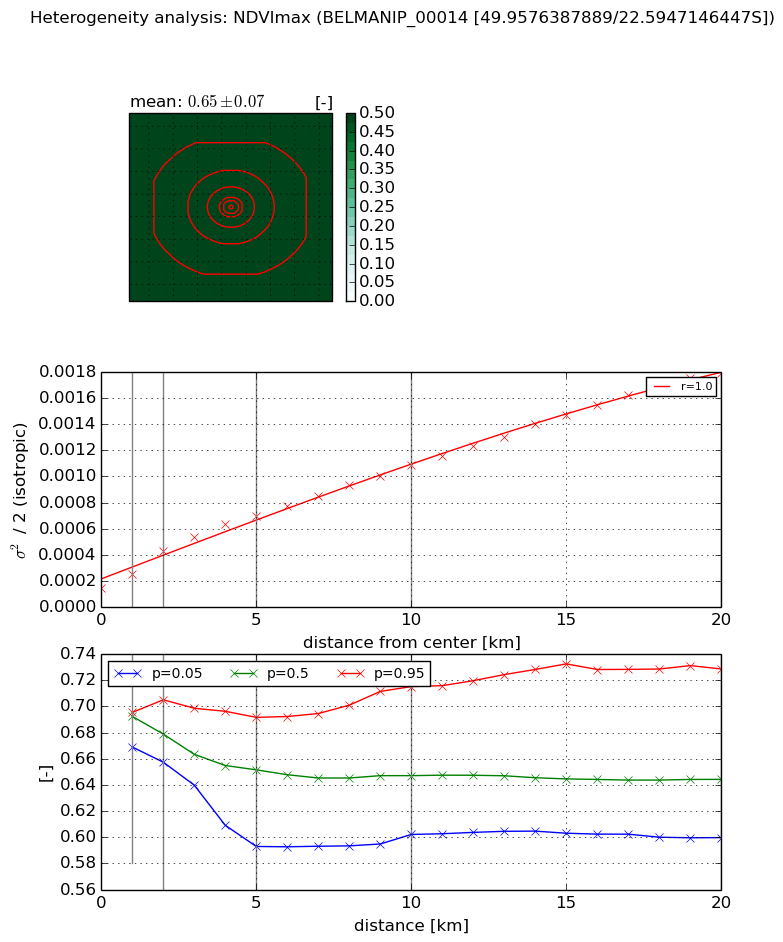
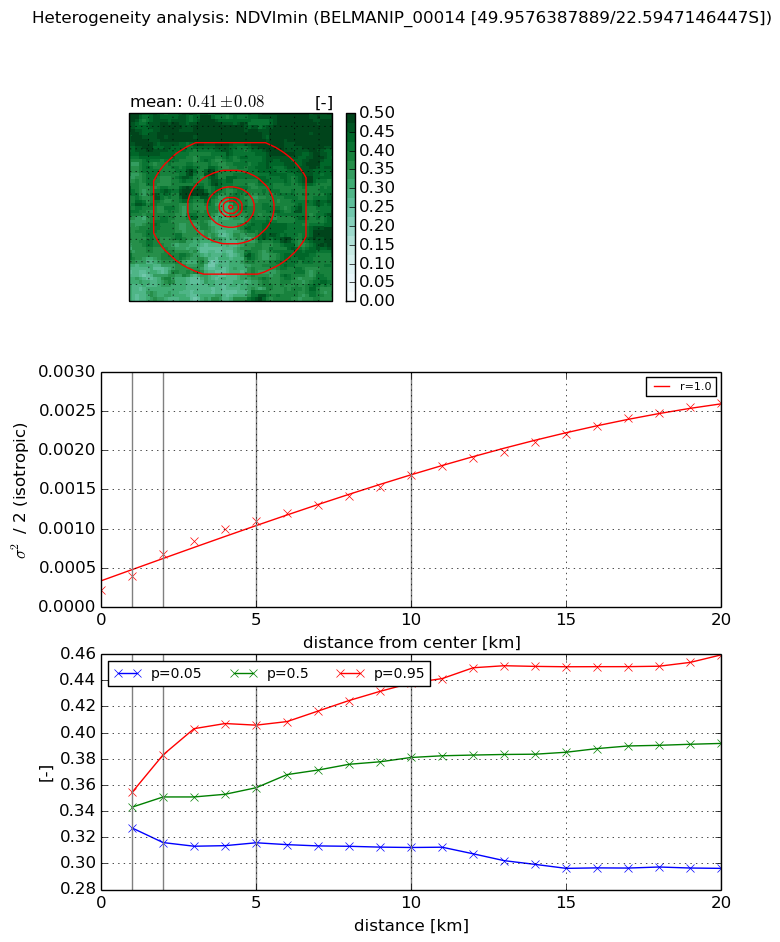
Heterogeneity analysis

The heterogeneity analysis provides information about the spatial and temporal heterogeneity of the site.

Topography


Roman et al. (2009) index


St

8.98772107484

Rcv

0.144993461717

Rse

0.0

Rst

0.036764099007

Rsv

-0.152031168924


Height range @ 1km [m]

44

Height range @ 2km [m]

75

Height range @ 5km [m]

89

Height range @ 10km [m]

-999

Height range @ 20km [m]

-999


Variance slope @ 1 km

300

Variance slope @ 2 km

280

Variance slope @ 5 km

163

Variance slope @ 10 km

-999

Variance slope @ 20 km

-999


NDVI (max. NDVI composite)


Roman et al. (2009) index


St

1.74629312332

Rcv

0.430322411227

Rse

0.0

Rst

-0.384919999664

Rsv

0.902682237576


NDVI range @ 1km [-]

0.03

NDVI range @ 2km [-]

0.05

NDVI range @ 5km [-]

0.1

NDVI range @ 10km [-]

0.11

NDVI range @ 20km [-]

0.13


Variance slope @ 1 km

0.000108346482895

Variance slope @ 2 km

0.000142996403465

Variance slope @ 5 km

0.00011538475374

Variance slope @ 10 km

9.07599330298e-05

Variance slope @ 20 km

8.00126523223e-05


NDVI (min. NDVI composite)I


Roman et al. (2009) index


St

10.989500207

Rcv

-0.0849632336186

Rse

0.0

Rst

0.0670713468576

Rsv

-0.120953266423


NDVI range @ 1km [-]

0.03

NDVI range @ 2km [-]

0.07

NDVI range @ 5km [-]

0.09

NDVI range @ 10km [-]

0.13

NDVI range @ 20km [-]

0.16


NDVI slope @ 1 km

0.000177432459226

NDVI slope @ 2 km

0.000231466946535

NDVI slope @ 5 km

0.000182197660331

NDVI slope @ 10 km

0.00013867189228

NDVI slope @ 20 km

0.000115362872575


Temporal stability analysis

+000 deg (BHR)


BHR statistics

Temporal stability [1/decade]:


abs

rel


Weighted least square:

-99999.0


Ordinary least square:

-99999.0


Probabilities that GCOS criteria is met:

Weighted least square:

-99999.0 %

Ordinary least square:

-99999.0 %


DHR statistics

Temporal stability [1/decade]:


abs

rel


Weighted least square:

-99999.0


Ordinary least square:

-99999.0


Probabilities that GCOS criteria is met:

Weighted least square:

-99999.0 %

Ordinary least square:

-99999.0 %


+057/+063 deg (BHR)


BHR statistics

Temporal stability [1/decade]:


abs

rel


Weighted least square:

None


Ordinary least square:

None


Probabilities that GCOS criteria is met:

Weighted least square:

None %

Ordinary least square:

None %


DHR statistics

Temporal stability [1/decade]:


abs

rel


Weighted least square:

None


Ordinary least square:

None


Probabilities that GCOS criteria is met:

Weighted least square:

None %

Ordinary least square:

None %


Temporal anomaly analyis

The variance of the temporal anomalies provides an additional measure about the stability of the signal AFTER removal of the mean seasonal cylce.

+000 deg


+057/+063 deg