BELMANIP_00021


Location

lon / lat [deg]: -70.6541 / -14.311

Source network: BELMANIP


Geostationary surface albedo (GSA) data


“+000”


“+057/+063”


Landcover information (based on ESA CCI landcover data)


Landcover fractions @ 2km distance


Landcover fractions @ 20 km distance


Legend


Distance to open water bodies [km]:

33.26

Distance to urban areas [km]:

19.52


Radius: 1 km

Number of landcover classes:

2

Dominant landcover type:

130: grassland

Fraction of dominant landcover type [%]:

97.0


Radius: 2 km

Number of landcover classes:

3

Dominant landcover type:

130: grassland

Fraction of dominant landcover type [%]:

94.0


Radius: 5 km

Number of landcover classes:

3

Dominant landcover type:

130: grassland

Fraction of dominant landcover type [%]:

95.0


Radius: 10 km

Number of landcover classes:

3

Dominant landcover type:

130: grassland

Fraction of dominant landcover type [%]:

93.0


Radius: 20 km

Number of landcover classes:

5

Dominant landcover type:

130: grassland

Fraction of dominant landcover type [%]:

83.0


Disturbances


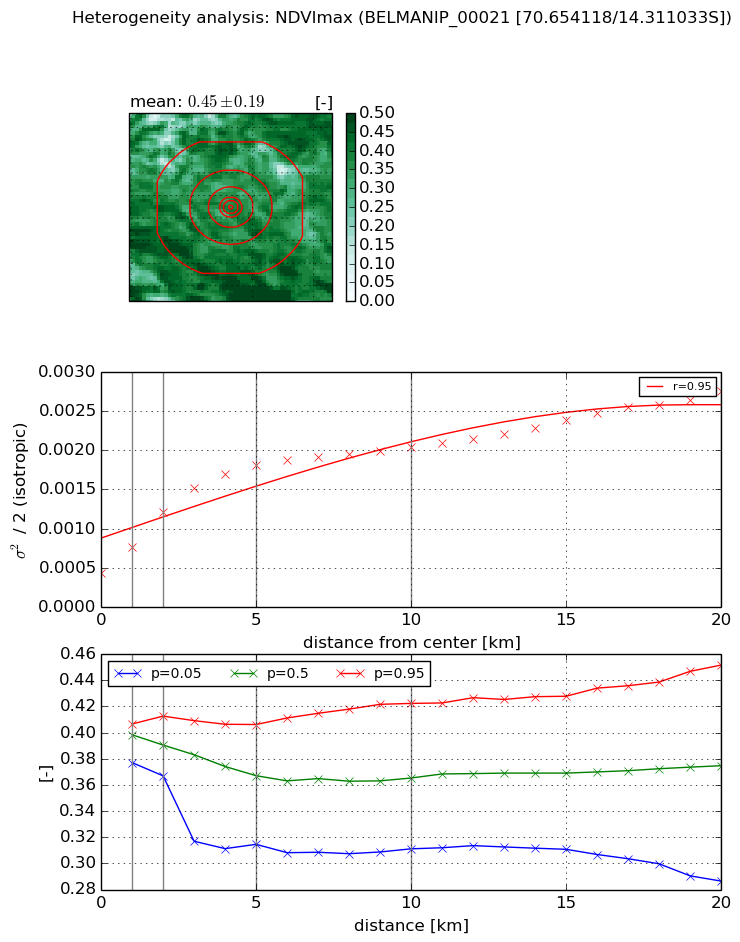
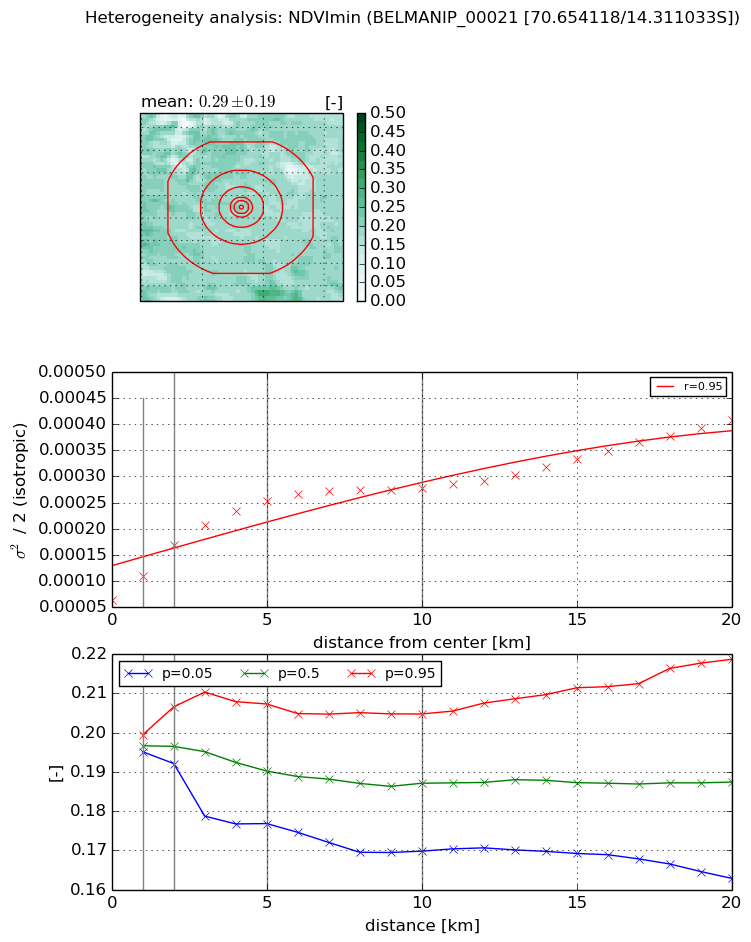
Heterogeneity analysis

The heterogeneity analysis provides information about the spatial and temporal heterogeneity of the site.

Topography


Roman et al. (2009) index


St

4.70830811238

Rcv

0.0719821486809

Rse

0.0

Rst

0.153557440581

Rsv

-0.411631965444


Height range @ 1km [m]

283

Height range @ 2km [m]

364

Height range @ 5km [m]

450

Height range @ 10km [m]

-999

Height range @ 20km [m]

-999


Variance slope @ 1 km

8324

Variance slope @ 2 km

8523

Variance slope @ 5 km

3895

Variance slope @ 10 km

-999

Variance slope @ 20 km

-999


NDVI (max. NDVI composite)


Roman et al. (2009) index


St

9.7510734891e-07

Rcv

0.0252827396634

Rse

0.0

Rst

1.10161919644

Rsv

3076583.21364


NDVI range @ 1km [-]

0.03

NDVI range @ 2km [-]

0.05

NDVI range @ 5km [-]

0.09

NDVI range @ 10km [-]

0.11

NDVI range @ 20km [-]

0.17


Variance slope @ 1 km

0.000331994355469

Variance slope @ 2 km

0.000390841081434

Variance slope @ 5 km

0.000284388247187

Variance slope @ 10 km

0.000146313368821

Variance slope @ 20 km

8.93199055229e-05


NDVI (min. NDVI composite)I


Roman et al. (2009) index


St

2.39132358767e-07

Rcv

-0.0357593950955

Rse

0.0

Rst

0.904535445291

Rsv

12545352.6683


NDVI range @ 1km [-]

0.0

NDVI range @ 2km [-]

0.01

NDVI range @ 5km [-]

0.03

NDVI range @ 10km [-]

0.03

NDVI range @ 20km [-]

0.06


NDVI slope @ 1 km

4.60541362838e-05

NDVI slope @ 2 km

5.31324837053e-05

NDVI slope @ 5 km

3.87429450042e-05

NDVI slope @ 10 km

2.00517250888e-05

NDVI slope @ 20 km

1.32509383174e-05


Temporal stability analysis

+000 deg (BHR)


BHR statistics

Temporal stability [1/decade]:


abs

rel


Weighted least square:

-99999.0


Ordinary least square:

-99999.0


Probabilities that GCOS criteria is met:

Weighted least square:

-99999.0 %

Ordinary least square:

-99999.0 %


DHR statistics

Temporal stability [1/decade]:


abs

rel


Weighted least square:

-99999.0


Ordinary least square:

-99999.0


Probabilities that GCOS criteria is met:

Weighted least square:

-99999.0 %

Ordinary least square:

-99999.0 %


+057/+063 deg (BHR)


BHR statistics

Temporal stability [1/decade]:


abs

rel


Weighted least square:

None


Ordinary least square:

None


Probabilities that GCOS criteria is met:

Weighted least square:

None %

Ordinary least square:

None %


DHR statistics

Temporal stability [1/decade]:


abs

rel


Weighted least square:

None


Ordinary least square:

None


Probabilities that GCOS criteria is met:

Weighted least square:

None %

Ordinary least square:

None %


Temporal anomaly analyis

The variance of the temporal anomalies provides an additional measure about the stability of the signal AFTER removal of the mean seasonal cylce.

+000 deg


+057/+063 deg