BELMANIP_00052


Location

lon / lat [deg]: -93.3202 / 16.6318

Source network: BELMANIP


Geostationary surface albedo (GSA) data


“+000”


“+057/+063”


Landcover information (based on ESA CCI landcover data)


Landcover fractions @ 2km distance


Landcover fractions @ 20 km distance


Legend


Distance to open water bodies [km]:

10.13

Distance to urban areas [km]:

14.08


Radius: 1 km

Number of landcover classes:

4

Dominant landcover type:

130: grassland

Fraction of dominant landcover type [%]:

50.0


Radius: 2 km

Number of landcover classes:

5

Dominant landcover type:

130: grassland

Fraction of dominant landcover type [%]:

44.0


Radius: 5 km

Number of landcover classes:

5

Dominant landcover type:

130: grassland

Fraction of dominant landcover type [%]:

36.0


Radius: 10 km

Number of landcover classes:

6

Dominant landcover type:

60: Tree cover, broadleaved, decidous

Fraction of dominant landcover type [%]:

27.0


Radius: 20 km

Number of landcover classes:

6

Dominant landcover type:

130: grassland

Fraction of dominant landcover type [%]:

26.0


Disturbances


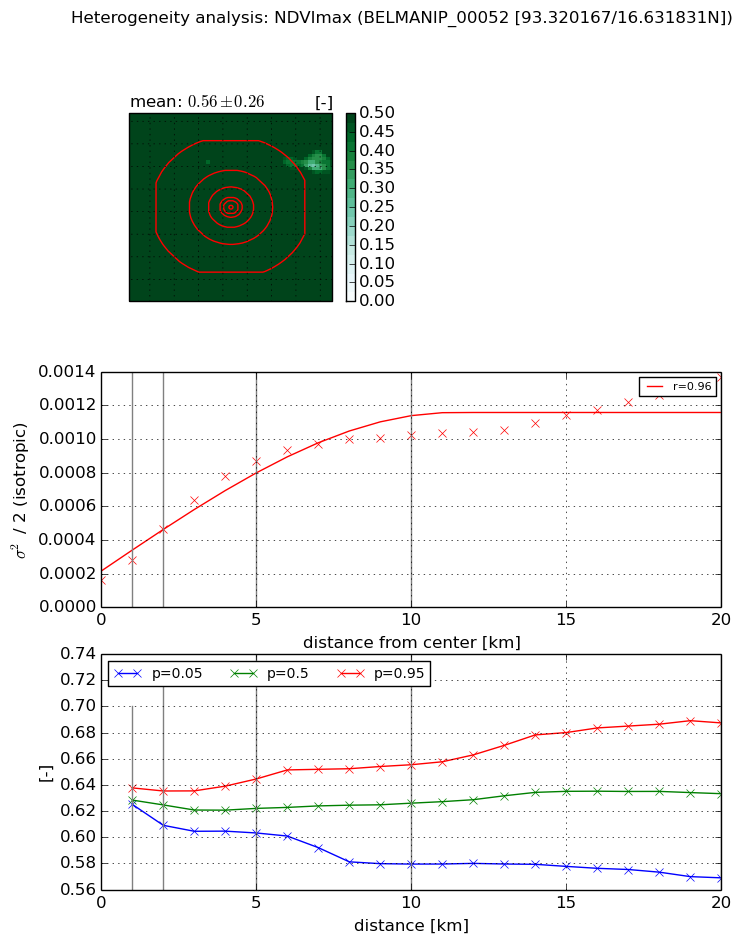
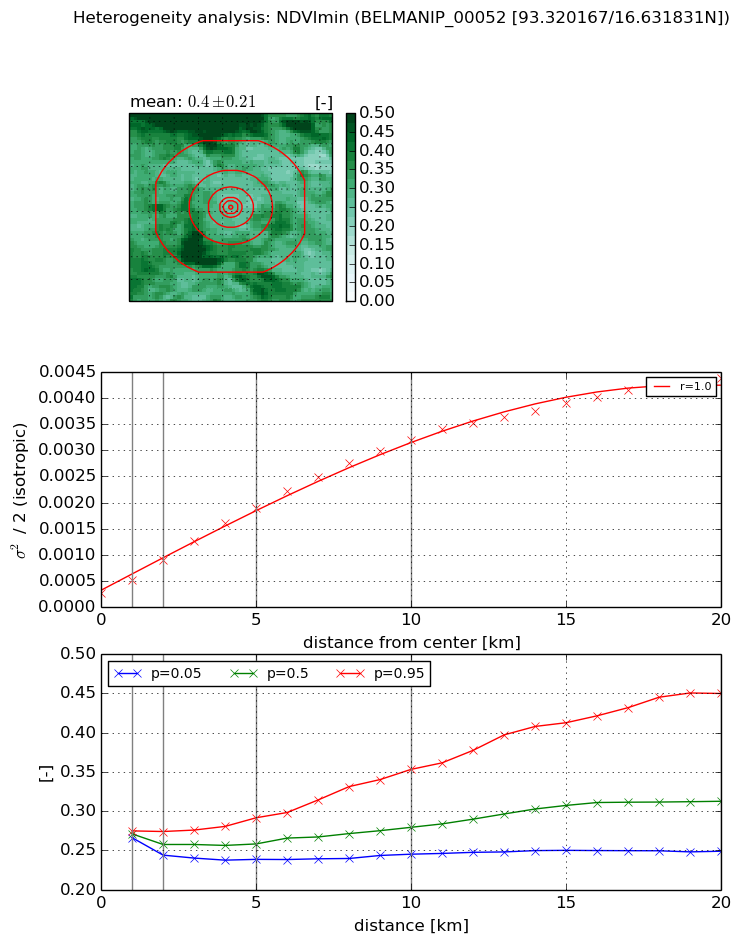
Heterogeneity analysis

The heterogeneity analysis provides information about the spatial and temporal heterogeneity of the site.

Topography


Roman et al. (2009) index


St

4.35759300323

Rcv

0.19777294155

Rse

0.0

Rst

-0.0545126980683

Rsv

0.436167824893


Height range @ 1km [m]

101

Height range @ 2km [m]

151

Height range @ 5km [m]

216

Height range @ 10km [m]

-999

Height range @ 20km [m]

-999


Variance slope @ 1 km

1557

Variance slope @ 2 km

1777

Variance slope @ 5 km

1185

Variance slope @ 10 km

-999

Variance slope @ 20 km

-999


NDVI (max. NDVI composite)


Roman et al. (2009) index


St

nan

Rcv

nan

Rse

nan

Rst

nan

Rsv

nan


NDVI range @ 1km [-]

0.01

NDVI range @ 2km [-]

0.03

NDVI range @ 5km [-]

0.04

NDVI range @ 10km [-]

0.08

NDVI range @ 20km [-]

0.12


Variance slope @ 1 km

0.00011907827584

Variance slope @ 2 km

0.000152782905301

Variance slope @ 5 km

0.000149059314364

Variance slope @ 10 km

8.75229307171e-05

Variance slope @ 20 km

4.73621568147e-05


NDVI (min. NDVI composite)I


Roman et al. (2009) index


St

1.61448449689

Rcv

0.387481283966

Rse

0.0

Rst

-0.470706405069

Rsv

-0.999990575155


NDVI range @ 1km [-]

0.01

NDVI range @ 2km [-]

0.03

NDVI range @ 5km [-]

0.05

NDVI range @ 10km [-]

0.11

NDVI range @ 20km [-]

0.2


NDVI slope @ 1 km

0.000232754910895

NDVI slope @ 2 km

0.000307399111485

NDVI slope @ 5 km

0.000334976167338

NDVI slope @ 10 km

0.000301403065429

NDVI slope @ 20 km

0.000205473725732


Temporal stability analysis

+000 deg (BHR)


BHR statistics

Temporal stability [1/decade]:


abs

rel


Weighted least square:

None


Ordinary least square:

None


Probabilities that GCOS criteria is met:

Weighted least square:

None %

Ordinary least square:

None %


DHR statistics

Temporal stability [1/decade]:


abs

rel


Weighted least square:

None


Ordinary least square:

None


Probabilities that GCOS criteria is met:

Weighted least square:

None %

Ordinary least square:

None %


+057/+063 deg (BHR)


BHR statistics

Temporal stability [1/decade]:


abs

rel


Weighted least square:

None


Ordinary least square:

None


Probabilities that GCOS criteria is met:

Weighted least square:

None %

Ordinary least square:

None %


DHR statistics

Temporal stability [1/decade]:


abs

rel


Weighted least square:

None


Ordinary least square:

None


Probabilities that GCOS criteria is met:

Weighted least square:

None %

Ordinary least square:

None %


Temporal anomaly analyis

The variance of the temporal anomalies provides an additional measure about the stability of the signal AFTER removal of the mean seasonal cylce.

+000 deg


+057/+063 deg