BELMANIP_00055


Location

lon / lat [deg]: -106.6815 / 26.5318

Source network: BELMANIP


Geostationary surface albedo (GSA) data


“+000”


“+057/+063”


Landcover information (based on ESA CCI landcover data)


Landcover fractions @ 2km distance


Landcover fractions @ 20 km distance


Legend


Distance to open water bodies [km]:

20.38

Distance to urban areas [km]:

28.78


Radius: 1 km

Number of landcover classes:

1

Dominant landcover type:

70: Tree cover, needleleaved, evergreen, closed to open (>15%)

Fraction of dominant landcover type [%]:

100.0


Radius: 2 km

Number of landcover classes:

1

Dominant landcover type:

70: Tree cover, needleleaved, evergreen, closed to open (>15%)

Fraction of dominant landcover type [%]:

100.0


Radius: 5 km

Number of landcover classes:

3

Dominant landcover type:

70: Tree cover, needleleaved, evergreen, closed to open (>15%)

Fraction of dominant landcover type [%]:

96.0


Radius: 10 km

Number of landcover classes:

3

Dominant landcover type:

70: Tree cover, needleleaved, evergreen, closed to open (>15%)

Fraction of dominant landcover type [%]:

88.0


Radius: 20 km

Number of landcover classes:

4

Dominant landcover type:

70: Tree cover, needleleaved, evergreen, closed to open (>15%)

Fraction of dominant landcover type [%]:

77.0


Disturbances


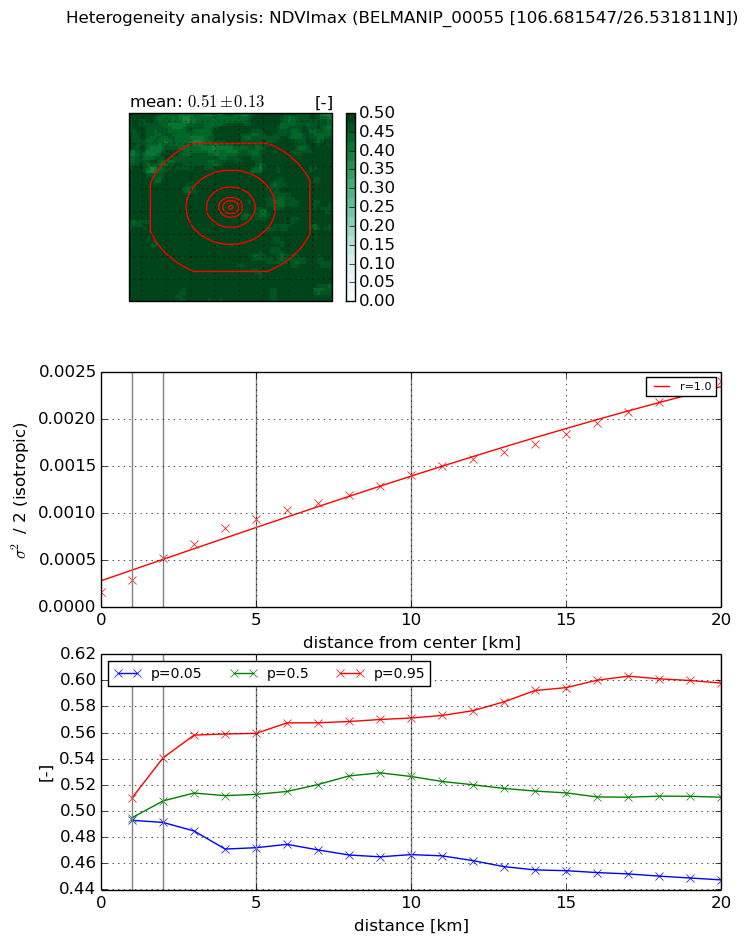
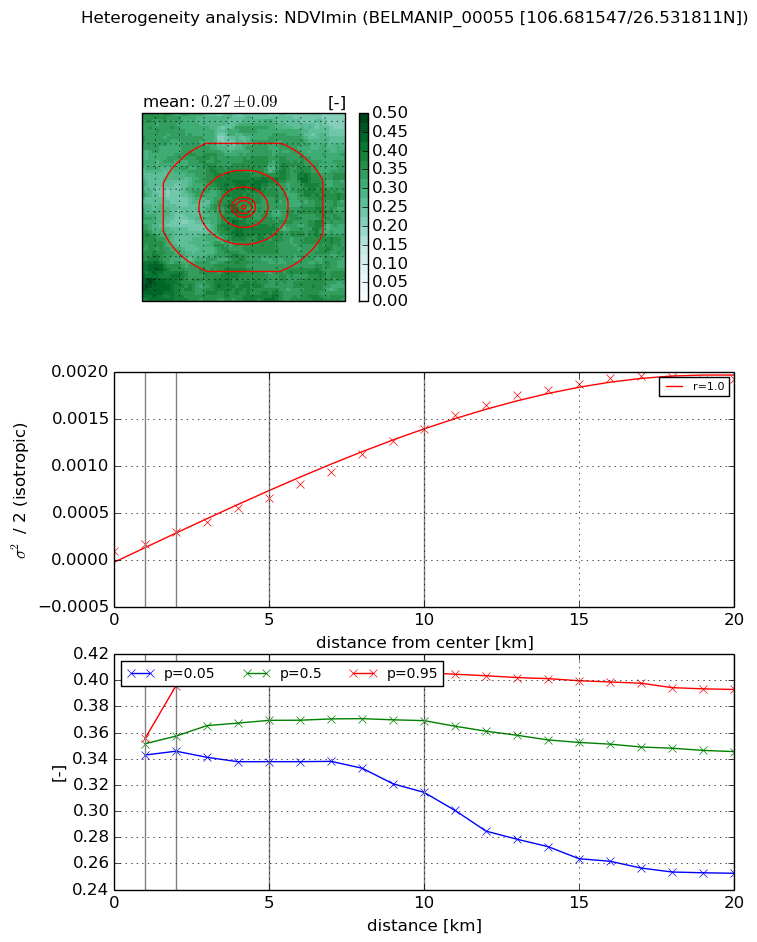
Heterogeneity analysis

The heterogeneity analysis provides information about the spatial and temporal heterogeneity of the site.

Topography


Roman et al. (2009) index


St

7.09504137253

Rcv

0.260043665657

Rse

0.0

Rst

0.0316247572927

Rsv

0.131162092404


Height range @ 1km [m]

186

Height range @ 2km [m]

262

Height range @ 5km [m]

348

Height range @ 10km [m]

-999

Height range @ 20km [m]

-999


Variance slope @ 1 km

4989

Variance slope @ 2 km

4035

Variance slope @ 5 km

2174

Variance slope @ 10 km

-999

Variance slope @ 20 km

-999


NDVI (max. NDVI composite)


Roman et al. (2009) index


St

0.00700357470871

Rcv

0.243585344037

Rse

0.0

Rst

1.32907578789e-07

Rsv

428.109095086


NDVI range @ 1km [-]

0.02

NDVI range @ 2km [-]

0.05

NDVI range @ 5km [-]

0.09

NDVI range @ 10km [-]

0.1

NDVI range @ 20km [-]

0.15


Variance slope @ 1 km

0.000131797708056

Variance slope @ 2 km

0.000180031965322

Variance slope @ 5 km

0.000162572898937

Variance slope @ 10 km

0.000120855905264

Variance slope @ 20 km

0.000104069510648


NDVI (min. NDVI composite)I


Roman et al. (2009) index


St

1.379612924e-07

Rcv

0.0282861680341

Rse

0.0

Rst

0.255030908344

Rsv

21745229.4678


NDVI range @ 1km [-]

0.01

NDVI range @ 2km [-]

0.05

NDVI range @ 5km [-]

0.07

NDVI range @ 10km [-]

0.09

NDVI range @ 20km [-]

0.14


NDVI slope @ 1 km

7.17560557437e-05

NDVI slope @ 2 km

0.000103384218253

NDVI slope @ 5 km

0.000116031466507

NDVI slope @ 10 km

0.000133371904813

NDVI slope @ 20 km

0.000104045977402


Temporal stability analysis

+000 deg (BHR)


BHR statistics

Temporal stability [1/decade]:


abs

rel


Weighted least square:

None


Ordinary least square:

None


Probabilities that GCOS criteria is met:

Weighted least square:

None %

Ordinary least square:

None %


DHR statistics

Temporal stability [1/decade]:


abs

rel


Weighted least square:

None


Ordinary least square:

None


Probabilities that GCOS criteria is met:

Weighted least square:

None %

Ordinary least square:

None %


+057/+063 deg (BHR)


BHR statistics

Temporal stability [1/decade]:


abs

rel


Weighted least square:

None


Ordinary least square:

None


Probabilities that GCOS criteria is met:

Weighted least square:

None %

Ordinary least square:

None %


DHR statistics

Temporal stability [1/decade]:


abs

rel


Weighted least square:

None


Ordinary least square:

None


Probabilities that GCOS criteria is met:

Weighted least square:

None %

Ordinary least square:

None %


Temporal anomaly analyis

The variance of the temporal anomalies provides an additional measure about the stability of the signal AFTER removal of the mean seasonal cylce.

+000 deg


+057/+063 deg