BELMANIP_00058


Location

lon / lat [deg]: -98.1605 / 28.891

Source network: BELMANIP


Geostationary surface albedo (GSA) data


“+000”


“+057/+063”


Landcover information (based on ESA CCI landcover data)


Landcover fractions @ 2km distance


Landcover fractions @ 20 km distance


Legend


Distance to open water bodies [km]:

8.19

Distance to urban areas [km]:

2.77


Radius: 1 km

Number of landcover classes:

3

Dominant landcover type:

130: grassland

Fraction of dominant landcover type [%]:

83.0


Radius: 2 km

Number of landcover classes:

3

Dominant landcover type:

130: grassland

Fraction of dominant landcover type [%]:

69.0


Radius: 5 km

Number of landcover classes:

3

Dominant landcover type:

130: grassland

Fraction of dominant landcover type [%]:

85.0


Radius: 10 km

Number of landcover classes:

3

Dominant landcover type:

130: grassland

Fraction of dominant landcover type [%]:

88.0


Radius: 20 km

Number of landcover classes:

5

Dominant landcover type:

130: grassland

Fraction of dominant landcover type [%]:

92.0


Disturbances


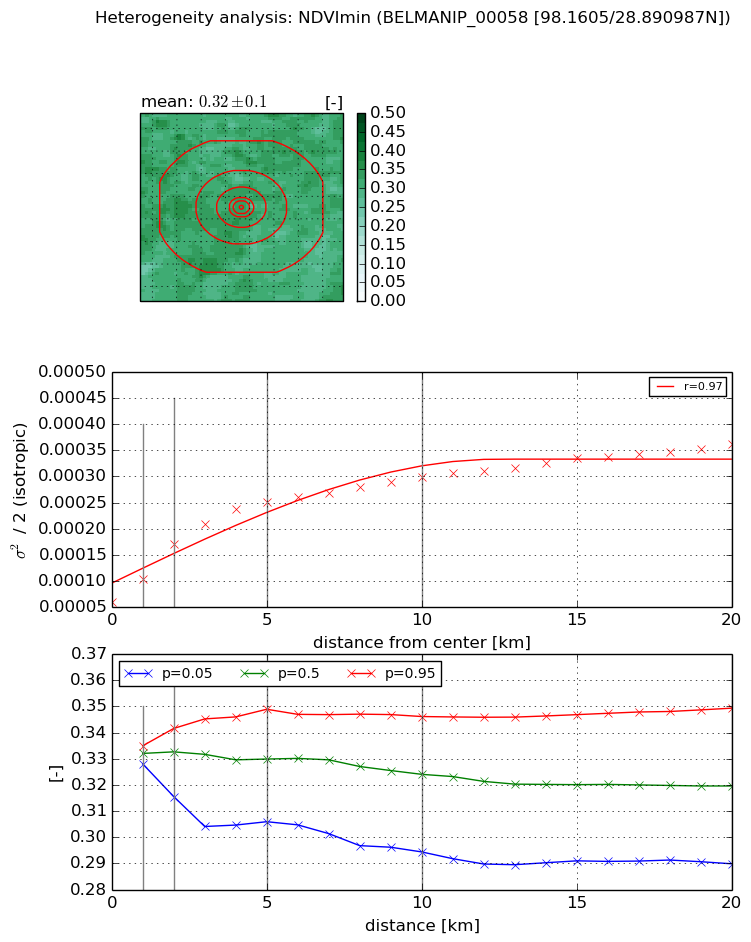
Heterogeneity analysis

The heterogeneity analysis provides information about the spatial and temporal heterogeneity of the site.

Topography


Roman et al. (2009) index


St

5.08290004221

Rcv

0.355369787404

Rse

0.0

Rst

0.0076235569903

Rsv

-0.227220898476


Height range @ 1km [m]

20

Height range @ 2km [m]

28

Height range @ 5km [m]

43

Height range @ 10km [m]

-999

Height range @ 20km [m]

-999


Variance slope @ 1 km

43

Variance slope @ 2 km

39

Variance slope @ 5 km

35

Variance slope @ 10 km

-999

Variance slope @ 20 km

-999


NDVI (max. NDVI composite)


Roman et al. (2009) index


St

1.26928644961e-07

Rcv

0.0105294901209

Rse

0.0

Rst

0.209340351692

Rsv

23635326.5492


NDVI range @ 1km [-]

0.01

NDVI range @ 2km [-]

0.03

NDVI range @ 5km [-]

0.05

NDVI range @ 10km [-]

0.08

NDVI range @ 20km [-]

0.09


Variance slope @ 1 km

8.6106313441e-05

Variance slope @ 2 km

0.000113833273776

Variance slope @ 5 km

9.12219381505e-05

Variance slope @ 10 km

5.18835275559e-05

Variance slope @ 20 km

2.29003202539e-05


NDVI (min. NDVI composite)I


Roman et al. (2009) index


St

13.0345494692

Rcv

-0.0582441249071

Rse

0.0

Rst

0.0502243724965

Rsv

-0.121689054807


NDVI range @ 1km [-]

0.01

NDVI range @ 2km [-]

0.03

NDVI range @ 5km [-]

0.04

NDVI range @ 10km [-]

0.05

NDVI range @ 20km [-]

0.06


NDVI slope @ 1 km

4.41687278813e-05

NDVI slope @ 2 km

5.54688605798e-05

NDVI slope @ 5 km

3.96605553882e-05

NDVI slope @ 10 km

2.17790874444e-05

NDVI slope @ 20 km

1.17980524218e-05


Temporal stability analysis

+000 deg (BHR)


BHR statistics

Temporal stability [1/decade]:


abs

rel


Weighted least square:

None


Ordinary least square:

None


Probabilities that GCOS criteria is met:

Weighted least square:

None %

Ordinary least square:

None %


DHR statistics

Temporal stability [1/decade]:


abs

rel


Weighted least square:

None


Ordinary least square:

None


Probabilities that GCOS criteria is met:

Weighted least square:

None %

Ordinary least square:

None %


+057/+063 deg (BHR)


BHR statistics

Temporal stability [1/decade]:


abs

rel


Weighted least square:

None


Ordinary least square:

None


Probabilities that GCOS criteria is met:

Weighted least square:

None %

Ordinary least square:

None %


DHR statistics

Temporal stability [1/decade]:


abs

rel


Weighted least square:

None


Ordinary least square:

None


Probabilities that GCOS criteria is met:

Weighted least square:

None %

Ordinary least square:

None %


Temporal anomaly analyis

The variance of the temporal anomalies provides an additional measure about the stability of the signal AFTER removal of the mean seasonal cylce.

+000 deg


+057/+063 deg