BELMANIP_00063


Location

lon / lat [deg]: -110.5081 / 34.2604

Source network: BELMANIP


Geostationary surface albedo (GSA) data


“+000”


“+057/+063”


Landcover information (based on ESA CCI landcover data)


Landcover fractions @ 2km distance


Landcover fractions @ 20 km distance


Legend


Distance to open water bodies [km]:

11.75

Distance to urban areas [km]:

14.73


Radius: 1 km

Number of landcover classes:

1

Dominant landcover type:

70: Tree cover, needleleaved, evergreen, closed to open (>15%)

Fraction of dominant landcover type [%]:

100.0


Radius: 2 km

Number of landcover classes:

1

Dominant landcover type:

70: Tree cover, needleleaved, evergreen, closed to open (>15%)

Fraction of dominant landcover type [%]:

100.0


Radius: 5 km

Number of landcover classes:

2

Dominant landcover type:

70: Tree cover, needleleaved, evergreen, closed to open (>15%)

Fraction of dominant landcover type [%]:

92.0


Radius: 10 km

Number of landcover classes:

2

Dominant landcover type:

70: Tree cover, needleleaved, evergreen, closed to open (>15%)

Fraction of dominant landcover type [%]:

87.0


Radius: 20 km

Number of landcover classes:

2

Dominant landcover type:

70: Tree cover, needleleaved, evergreen, closed to open (>15%)

Fraction of dominant landcover type [%]:

77.0


Disturbances


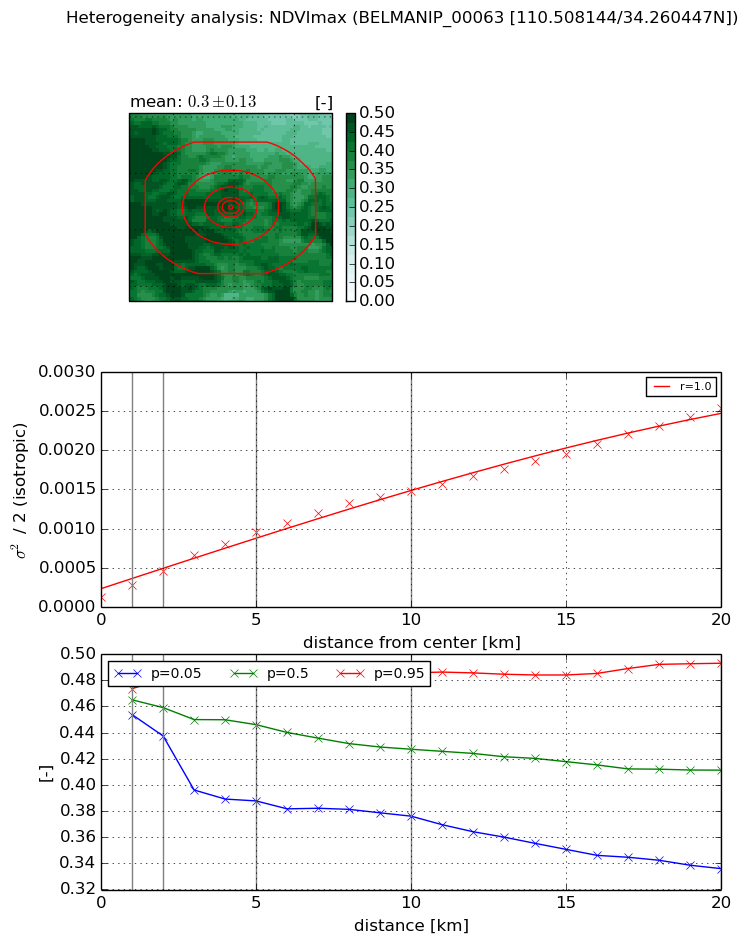
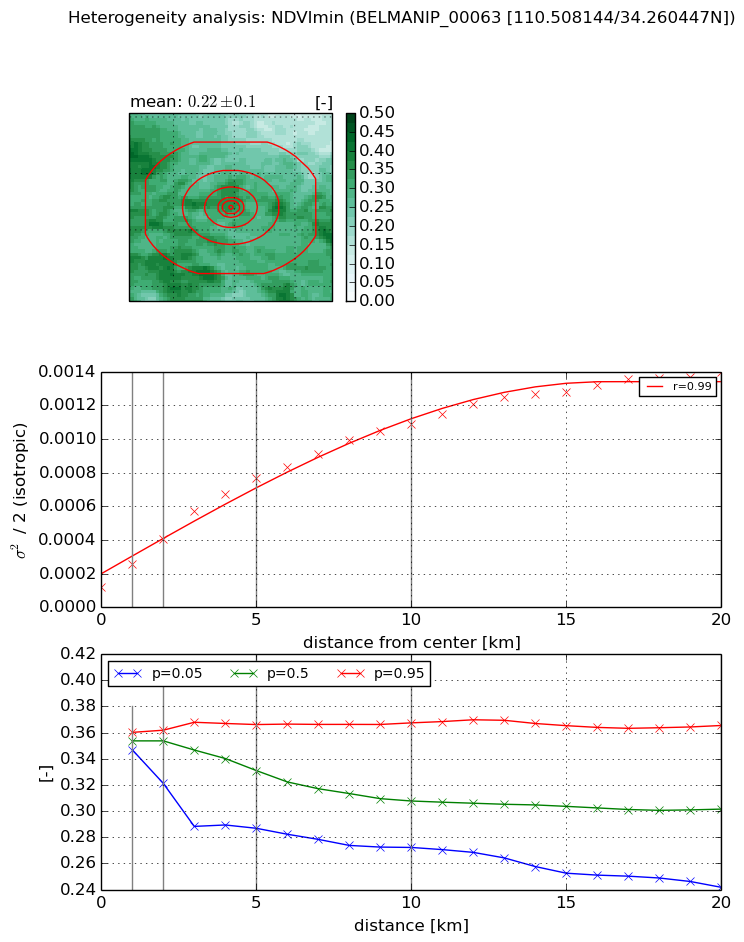
Heterogeneity analysis

The heterogeneity analysis provides information about the spatial and temporal heterogeneity of the site.

Topography


Roman et al. (2009) index


St

2.25092066595

Rcv

0.445230506286

Rse

0.0

Rst

1.9847232453e-08

Rsv

-0.88755745053


Height range @ 1km [m]

127

Height range @ 2km [m]

176

Height range @ 5km [m]

282

Height range @ 10km [m]

-999

Height range @ 20km [m]

-999


Variance slope @ 1 km

1643

Variance slope @ 2 km

1313

Variance slope @ 5 km

1265

Variance slope @ 10 km

-999

Variance slope @ 20 km

-999


NDVI (max. NDVI composite)


Roman et al. (2009) index


St

1.53418860444e-06

Rcv

0.161901630947

Rse

0.0

Rst

0.194448251216

Rsv

1955430.6717


NDVI range @ 1km [-]

0.02

NDVI range @ 2km [-]

0.04

NDVI range @ 5km [-]

0.1

NDVI range @ 10km [-]

0.11

NDVI range @ 20km [-]

0.16


Variance slope @ 1 km

0.000151949562174

Variance slope @ 2 km

0.000162567618045

Variance slope @ 5 km

0.000169441071083

Variance slope @ 10 km

0.000137876115673

Variance slope @ 20 km

0.000113265942168


NDVI (min. NDVI composite)I


Roman et al. (2009) index


St

7.96005478344

Rcv

0.13749180073

Rse

0.0

Rst

-0.0152546504003

Rsv

0.224135377151


NDVI range @ 1km [-]

0.01

NDVI range @ 2km [-]

0.04

NDVI range @ 5km [-]

0.08

NDVI range @ 10km [-]

0.1

NDVI range @ 20km [-]

0.12


NDVI slope @ 1 km

0.000132621980256

NDVI slope @ 2 km

0.000141847230865

NDVI slope @ 5 km

0.000133297097913

NDVI slope @ 10 km

9.63587803798e-05

NDVI slope @ 20 km

5.93401537479e-05


Temporal stability analysis

+000 deg (BHR)


BHR statistics

Temporal stability [1/decade]:


abs

rel


Weighted least square:

None


Ordinary least square:

None


Probabilities that GCOS criteria is met:

Weighted least square:

None %

Ordinary least square:

None %


DHR statistics

Temporal stability [1/decade]:


abs

rel


Weighted least square:

None


Ordinary least square:

None


Probabilities that GCOS criteria is met:

Weighted least square:

None %

Ordinary least square:

None %


+057/+063 deg (BHR)


BHR statistics

Temporal stability [1/decade]:


abs

rel


Weighted least square:

None


Ordinary least square:

None


Probabilities that GCOS criteria is met:

Weighted least square:

None %

Ordinary least square:

None %


DHR statistics

Temporal stability [1/decade]:


abs

rel


Weighted least square:

None


Ordinary least square:

None


Probabilities that GCOS criteria is met:

Weighted least square:

None %

Ordinary least square:

None %


Temporal anomaly analyis

The variance of the temporal anomalies provides an additional measure about the stability of the signal AFTER removal of the mean seasonal cylce.

+000 deg


+057/+063 deg