BELMANIP_00064


Location

lon / lat [deg]: -92.6354 / 32.0534

Source network: BELMANIP


Geostationary surface albedo (GSA) data


“+000”


“+057/+063”


Landcover information (based on ESA CCI landcover data)


Landcover fractions @ 2km distance


Landcover fractions @ 20 km distance


Legend


Distance to open water bodies [km]:

1.01

Distance to urban areas [km]:

0.71


Radius: 1 km

Number of landcover classes:

2

Dominant landcover type:

70: Tree cover, needleleaved, evergreen, closed to open (>15%)

Fraction of dominant landcover type [%]:

92.0


Radius: 2 km

Number of landcover classes:

4

Dominant landcover type:

70: Tree cover, needleleaved, evergreen, closed to open (>15%)

Fraction of dominant landcover type [%]:

88.0


Radius: 5 km

Number of landcover classes:

5

Dominant landcover type:

70: Tree cover, needleleaved, evergreen, closed to open (>15%)

Fraction of dominant landcover type [%]:

83.0


Radius: 10 km

Number of landcover classes:

5

Dominant landcover type:

70: Tree cover, needleleaved, evergreen, closed to open (>15%)

Fraction of dominant landcover type [%]:

72.0


Radius: 20 km

Number of landcover classes:

5

Dominant landcover type:

70: Tree cover, needleleaved, evergreen, closed to open (>15%)

Fraction of dominant landcover type [%]:

73.0


Disturbances


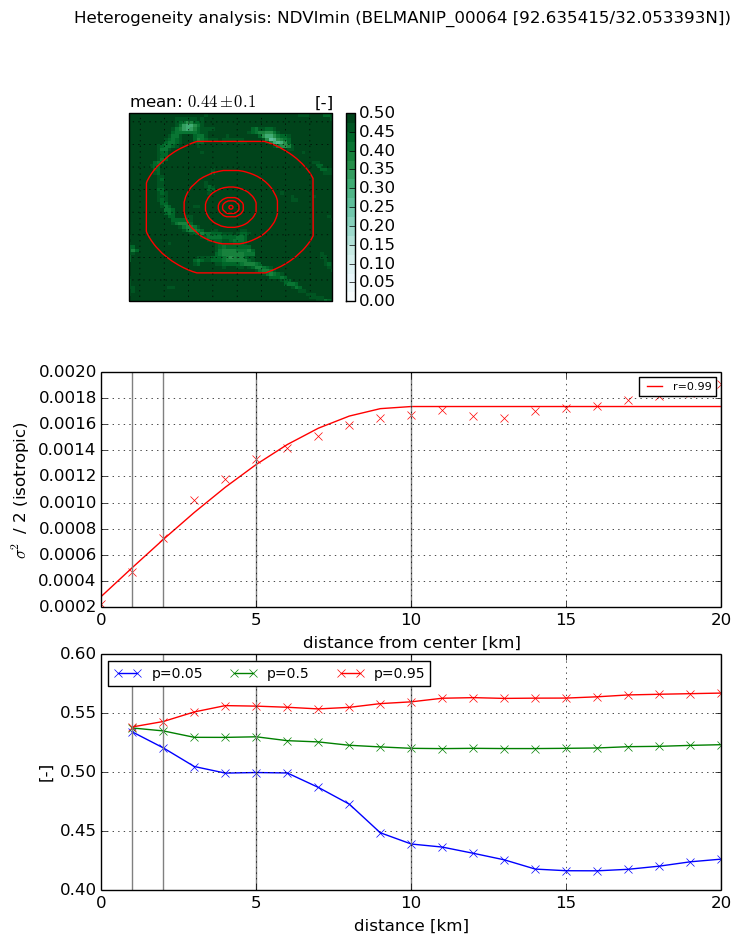
Heterogeneity analysis

The heterogeneity analysis provides information about the spatial and temporal heterogeneity of the site.

Topography


Roman et al. (2009) index


St

0.130407379264

Rcv

0.264141966243

Rse

0.0

Rst

-5.33141398682e-08

Rsv

22.740691119


Height range @ 1km [m]

19

Height range @ 2km [m]

22

Height range @ 5km [m]

34

Height range @ 10km [m]

-999

Height range @ 20km [m]

-999


Variance slope @ 1 km

40

Variance slope @ 2 km

29

Variance slope @ 5 km

19

Variance slope @ 10 km

-999

Variance slope @ 20 km

-999


NDVI (max. NDVI composite)


Roman et al. (2009) index


St

2.36438214482e-07

Rcv

0.175170250576

Rse

0.0

Rst

0.0998339488285

Rsv

12688303.9679


NDVI range @ 1km [-]

0.01

NDVI range @ 2km [-]

0.02

NDVI range @ 5km [-]

0.05

NDVI range @ 10km [-]

0.05

NDVI range @ 20km [-]

0.06


Variance slope @ 1 km

0.00010512050876

Variance slope @ 2 km

0.000101879207758

Variance slope @ 5 km

6.41953429097e-05

Variance slope @ 10 km

2.57651878031e-05

Variance slope @ 20 km

9.04202856986e-06


NDVI (min. NDVI composite)I


Roman et al. (2009) index


St

0.777728127186

Rcv

0.312716258046

Rse

0.0

Rst

-0.681171550413

Rsv

2.86350129081


NDVI range @ 1km [-]

0.0

NDVI range @ 2km [-]

0.02

NDVI range @ 5km [-]

0.06

NDVI range @ 10km [-]

0.12

NDVI range @ 20km [-]

0.14


NDVI slope @ 1 km

0.0002469170915

NDVI slope @ 2 km

0.000253219703862

NDVI slope @ 5 km

0.000226700418711

NDVI slope @ 10 km

0.000143134569243

NDVI slope @ 20 km

6.52020385247e-05


Temporal stability analysis

+000 deg (BHR)


BHR statistics

Temporal stability [1/decade]:


abs

rel


Weighted least square:

None


Ordinary least square:

None


Probabilities that GCOS criteria is met:

Weighted least square:

None %

Ordinary least square:

None %


DHR statistics

Temporal stability [1/decade]:


abs

rel


Weighted least square:

None


Ordinary least square:

None


Probabilities that GCOS criteria is met:

Weighted least square:

None %

Ordinary least square:

None %


+057/+063 deg (BHR)


BHR statistics

Temporal stability [1/decade]:


abs

rel


Weighted least square:

None


Ordinary least square:

None


Probabilities that GCOS criteria is met:

Weighted least square:

None %

Ordinary least square:

None %


DHR statistics

Temporal stability [1/decade]:


abs

rel


Weighted least square:

None


Ordinary least square:

None


Probabilities that GCOS criteria is met:

Weighted least square:

None %

Ordinary least square:

None %


Temporal anomaly analyis

The variance of the temporal anomalies provides an additional measure about the stability of the signal AFTER removal of the mean seasonal cylce.

+000 deg


+057/+063 deg