BELMANIP_00072


Location

lon / lat [deg]: -86.7947 / 36.7011

Source network: BELMANIP


Geostationary surface albedo (GSA) data


“+000”


“+057/+063”


Landcover information (based on ESA CCI landcover data)


Landcover fractions @ 2km distance


Landcover fractions @ 20 km distance


Legend


Distance to open water bodies [km]:

21.05

Distance to urban areas [km]:

6.27


Radius: 1 km

Number of landcover classes:

1

Dominant landcover type:

10: cropland, rainfed

Fraction of dominant landcover type [%]:

100.0


Radius: 2 km

Number of landcover classes:

1

Dominant landcover type:

10: cropland, rainfed

Fraction of dominant landcover type [%]:

100.0


Radius: 5 km

Number of landcover classes:

1

Dominant landcover type:

10: cropland, rainfed

Fraction of dominant landcover type [%]:

100.0


Radius: 10 km

Number of landcover classes:

3

Dominant landcover type:

10: cropland, rainfed

Fraction of dominant landcover type [%]:

92.0


Radius: 20 km

Number of landcover classes:

4

Dominant landcover type:

10: cropland, rainfed

Fraction of dominant landcover type [%]:

73.0


Disturbances


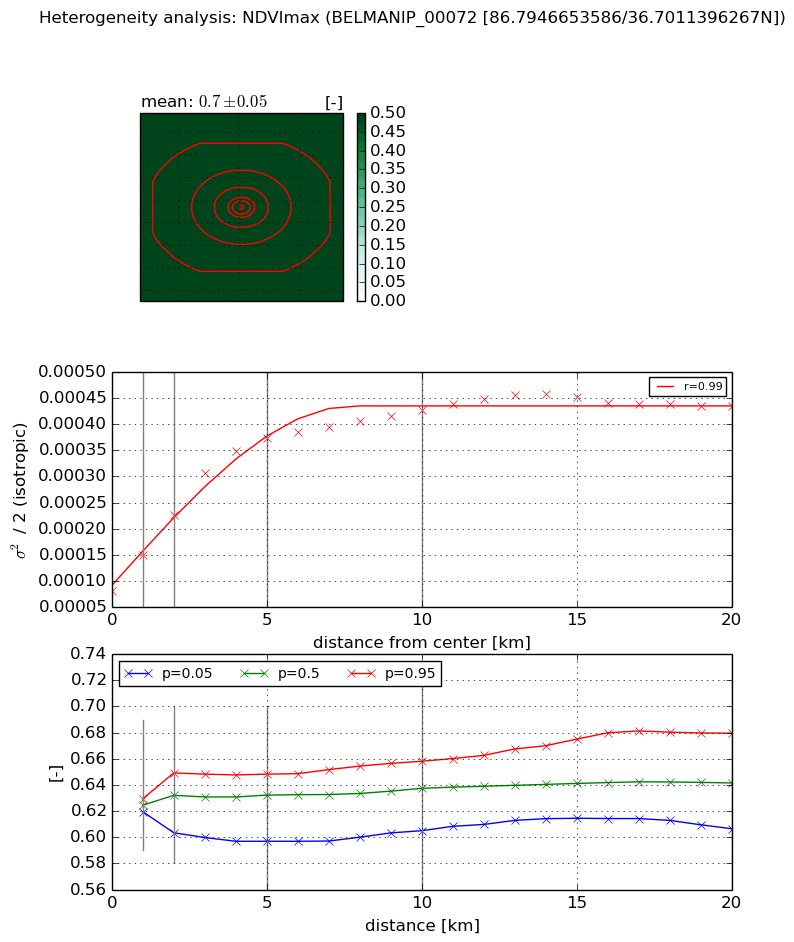
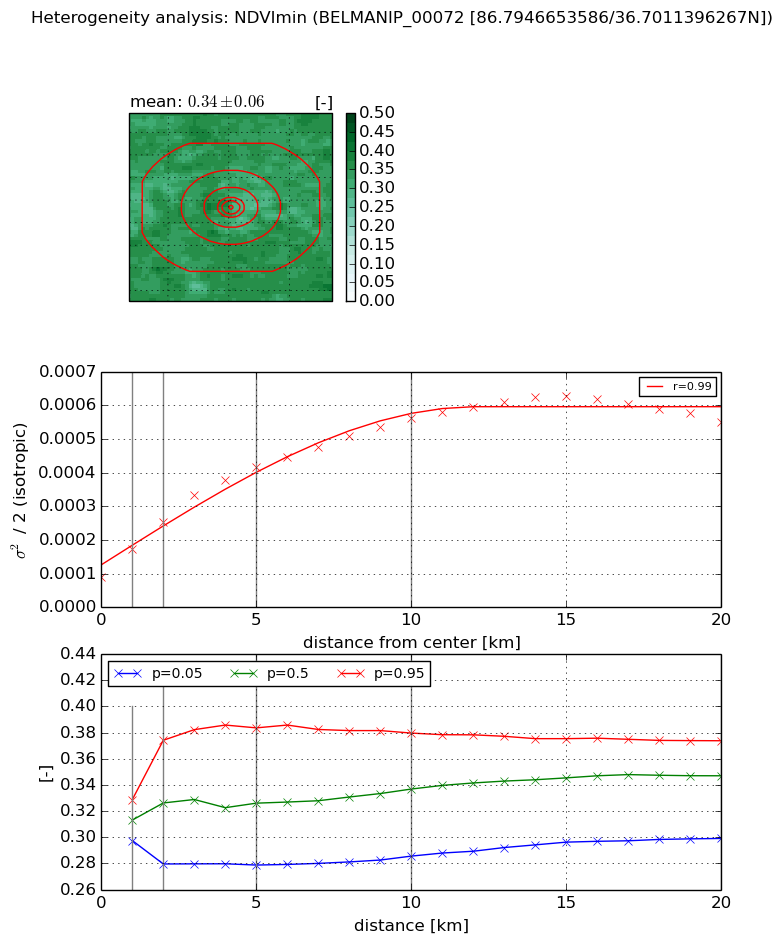
Heterogeneity analysis

The heterogeneity analysis provides information about the spatial and temporal heterogeneity of the site.

Topography


Roman et al. (2009) index


St

11.7280117688

Rcv

0.129728697974

Rse

0.0

Rst

-0.0469630640306

Rsv

-0.0791060713489


Height range @ 1km [m]

16

Height range @ 2km [m]

21

Height range @ 5km [m]

27

Height range @ 10km [m]

-999

Height range @ 20km [m]

-999


Variance slope @ 1 km

33

Variance slope @ 2 km

24

Variance slope @ 5 km

14

Variance slope @ 10 km

-999

Variance slope @ 20 km

-999


NDVI (max. NDVI composite)


Roman et al. (2009) index


St

27.6653001427

Rcv

0.0329571276304

Rse

0.0

Rst

-0.0743979950132

Rsv

-0.00108396836659


NDVI range @ 1km [-]

0.01

NDVI range @ 2km [-]

0.05

NDVI range @ 5km [-]

0.05

NDVI range @ 10km [-]

0.05

NDVI range @ 20km [-]

0.07


Variance slope @ 1 km

6.98624948623e-05

Variance slope @ 2 km

7.29919984129e-05

Variance slope @ 5 km

6.13488679422e-05

Variance slope @ 10 km

3.2201418401e-05

Variance slope @ 20 km

1.33233391816e-05


NDVI (min. NDVI composite)I


Roman et al. (2009) index


St

6.09571910626

Rcv

-0.0243776629734

Rse

0.0

Rst

0.0451280467079

Rsv

0.422642951979


NDVI range @ 1km [-]

0.03

NDVI range @ 2km [-]

0.09

NDVI range @ 5km [-]

0.1

NDVI range @ 10km [-]

0.09

NDVI range @ 20km [-]

0.07


NDVI slope @ 1 km

8.28869172569e-05

NDVI slope @ 2 km

8.19174103915e-05

NDVI slope @ 5 km

6.64119820637e-05

NDVI slope @ 10 km

4.47944905632e-05

NDVI slope @ 20 km

2.15965440515e-05


Temporal stability analysis

+000 deg (BHR)


BHR statistics

Temporal stability [1/decade]:


abs

rel


Weighted least square:

None


Ordinary least square:

None


Probabilities that GCOS criteria is met:

Weighted least square:

None %

Ordinary least square:

None %


DHR statistics

Temporal stability [1/decade]:


abs

rel


Weighted least square:

None


Ordinary least square:

None


Probabilities that GCOS criteria is met:

Weighted least square:

None %

Ordinary least square:

None %


+057/+063 deg (BHR)


BHR statistics

Temporal stability [1/decade]:


abs

rel


Weighted least square:

None


Ordinary least square:

None


Probabilities that GCOS criteria is met:

Weighted least square:

None %

Ordinary least square:

None %


DHR statistics

Temporal stability [1/decade]:


abs

rel


Weighted least square:

None


Ordinary least square:

None


Probabilities that GCOS criteria is met:

Weighted least square:

None %

Ordinary least square:

None %


Temporal anomaly analyis

The variance of the temporal anomalies provides an additional measure about the stability of the signal AFTER removal of the mean seasonal cylce.

+000 deg


+057/+063 deg