BELMANIP_00073


Location

lon / lat [deg]: -80.0014 / 33.9842

Source network: BELMANIP


Geostationary surface albedo (GSA) data


“+000”


“+057/+063”


Landcover information (based on ESA CCI landcover data)


Landcover fractions @ 2km distance


Landcover fractions @ 20 km distance


Legend


Distance to open water bodies [km]:

2.88

Distance to urban areas [km]:

1.62


Radius: 1 km

Number of landcover classes:

6

Dominant landcover type:

10: cropland, rainfed

Fraction of dominant landcover type [%]:

30.0


Radius: 2 km

Number of landcover classes:

7

Dominant landcover type:

70: Tree cover, needleleaved, evergreen, closed to open (>15%)

Fraction of dominant landcover type [%]:

44.0


Radius: 5 km

Number of landcover classes:

6

Dominant landcover type:

70: Tree cover, needleleaved, evergreen, closed to open (>15%)

Fraction of dominant landcover type [%]:

36.0


Radius: 10 km

Number of landcover classes:

6

Dominant landcover type:

70: Tree cover, needleleaved, evergreen, closed to open (>15%)

Fraction of dominant landcover type [%]:

31.0


Radius: 20 km

Number of landcover classes:

6

Dominant landcover type:

10: cropland, rainfed

Fraction of dominant landcover type [%]:

38.0


Disturbances


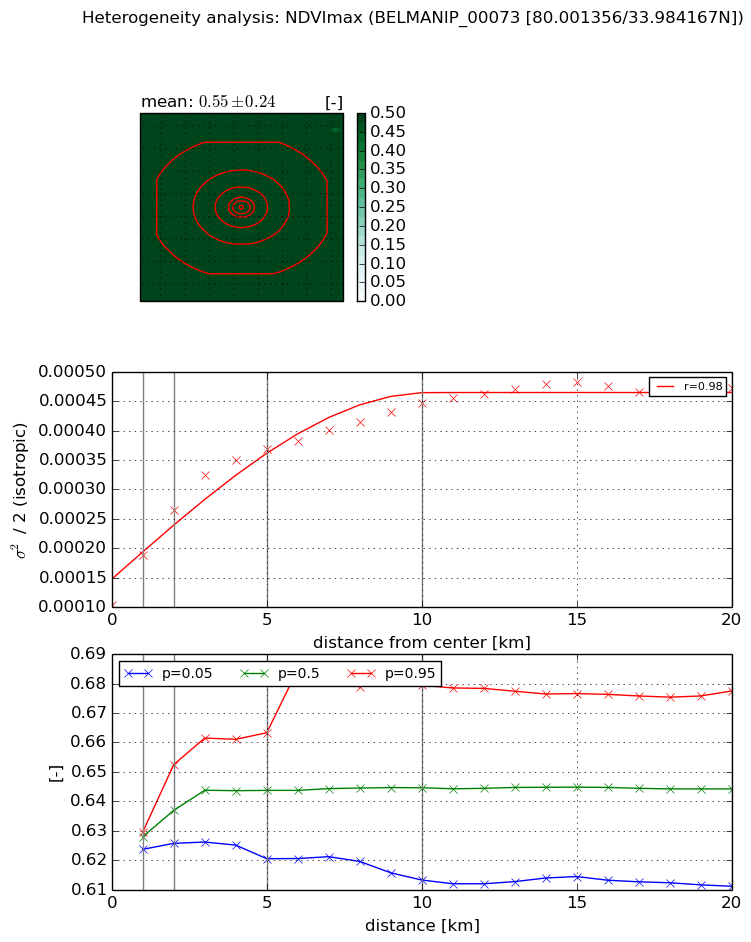
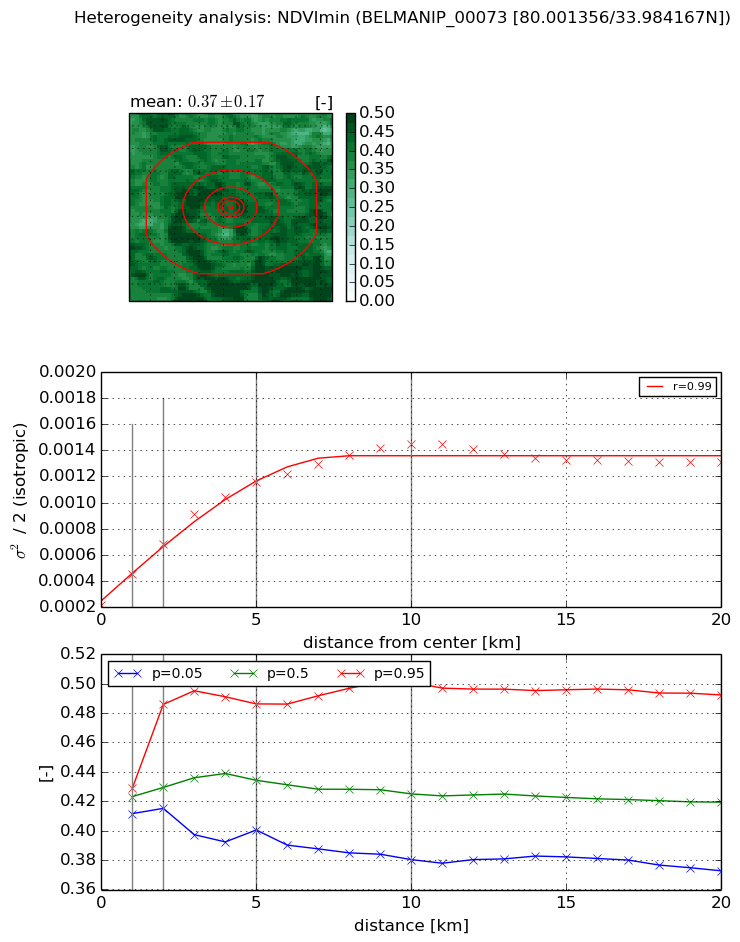
Heterogeneity analysis

The heterogeneity analysis provides information about the spatial and temporal heterogeneity of the site.

Topography


Roman et al. (2009) index


St

0.00286769189535

Rcv

0.0731374682144

Rse

0.0

Rst

-1.58445718737

Rsv

1044.47989482


Height range @ 1km [m]

6

Height range @ 2km [m]

8

Height range @ 5km [m]

10

Height range @ 10km [m]

-999

Height range @ 20km [m]

-999


Variance slope @ 1 km

5

Variance slope @ 2 km

2

Variance slope @ 5 km

1

Variance slope @ 10 km

-999

Variance slope @ 20 km

-999


NDVI (max. NDVI composite)


Roman et al. (2009) index


St

1.12295555228

Rcv

0.268572919065

Rse

0.0

Rst

-0.405287276237

Rsv

1.99766139245


NDVI range @ 1km [-]

0.01

NDVI range @ 2km [-]

0.03

NDVI range @ 5km [-]

0.04

NDVI range @ 10km [-]

0.07

NDVI range @ 20km [-]

0.07


Variance slope @ 1 km

8.61147681142e-05

Variance slope @ 2 km

8.12013010156e-05

Variance slope @ 5 km

5.3437590776e-05

Variance slope @ 10 km

3.02499949735e-05

Variance slope @ 20 km

1.40970903437e-05


NDVI (min. NDVI composite)I


Roman et al. (2009) index


St

2.40309725901

Rcv

-0.123980767087

Rse

0.0

Rst

-0.624021532233

Rsv

-0.50038662408


NDVI range @ 1km [-]

0.02

NDVI range @ 2km [-]

0.07

NDVI range @ 5km [-]

0.09

NDVI range @ 10km [-]

0.12

NDVI range @ 20km [-]

0.12


NDVI slope @ 1 km

0.00023897973104

NDVI slope @ 2 km

0.000234276288874

NDVI slope @ 5 km

0.00019072305038

NDVI slope @ 10 km

0.00011816357966

NDVI slope @ 20 km

3.89086132947e-05


Temporal stability analysis

+000 deg (BHR)


BHR statistics

Temporal stability [1/decade]:


abs

rel


Weighted least square:

None


Ordinary least square:

None


Probabilities that GCOS criteria is met:

Weighted least square:

None %

Ordinary least square:

None %


DHR statistics

Temporal stability [1/decade]:


abs

rel


Weighted least square:

None


Ordinary least square:

None


Probabilities that GCOS criteria is met:

Weighted least square:

None %

Ordinary least square:

None %


+057/+063 deg (BHR)


BHR statistics

Temporal stability [1/decade]:


abs

rel


Weighted least square:

None


Ordinary least square:

None


Probabilities that GCOS criteria is met:

Weighted least square:

None %

Ordinary least square:

None %


DHR statistics

Temporal stability [1/decade]:


abs

rel


Weighted least square:

None


Ordinary least square:

None


Probabilities that GCOS criteria is met:

Weighted least square:

None %

Ordinary least square:

None %


Temporal anomaly analyis

The variance of the temporal anomalies provides an additional measure about the stability of the signal AFTER removal of the mean seasonal cylce.

+000 deg


+057/+063 deg