BELMANIP_00078


Location

lon / lat [deg]: -123.6905 / 42.6026

Source network: BELMANIP


Geostationary surface albedo (GSA) data


“+000”


“+057/+063”


Landcover information (based on ESA CCI landcover data)


Landcover fractions @ 2km distance


Landcover fractions @ 20 km distance


Legend


Distance to open water bodies [km]:

6.19

Distance to urban areas [km]:

4.25


Radius: 1 km

Number of landcover classes:

1

Dominant landcover type:

70: Tree cover, needleleaved, evergreen, closed to open (>15%)

Fraction of dominant landcover type [%]:

100.0


Radius: 2 km

Number of landcover classes:

1

Dominant landcover type:

70: Tree cover, needleleaved, evergreen, closed to open (>15%)

Fraction of dominant landcover type [%]:

100.0


Radius: 5 km

Number of landcover classes:

1

Dominant landcover type:

70: Tree cover, needleleaved, evergreen, closed to open (>15%)

Fraction of dominant landcover type [%]:

100.0


Radius: 10 km

Number of landcover classes:

1

Dominant landcover type:

70: Tree cover, needleleaved, evergreen, closed to open (>15%)

Fraction of dominant landcover type [%]:

100.0


Radius: 20 km

Number of landcover classes:

1

Dominant landcover type:

70: Tree cover, needleleaved, evergreen, closed to open (>15%)

Fraction of dominant landcover type [%]:

99.0


Disturbances


Heterogeneity analysis

The heterogeneity analysis provides information about the spatial and temporal heterogeneity of the site.

Topography


Roman et al. (2009) index


St

2.55787709893

Rcv

0.0649574824271

Rse

0.0

Rst

-0.162054576856

Rsv

0.945835534235


Height range @ 1km [m]

341

Height range @ 2km [m]

583

Height range @ 5km [m]

696

Height range @ 10km [m]

-999

Height range @ 20km [m]

-999


Variance slope @ 1 km

18534

Variance slope @ 2 km

17941

Variance slope @ 5 km

10131

Variance slope @ 10 km

-999

Variance slope @ 20 km

-999


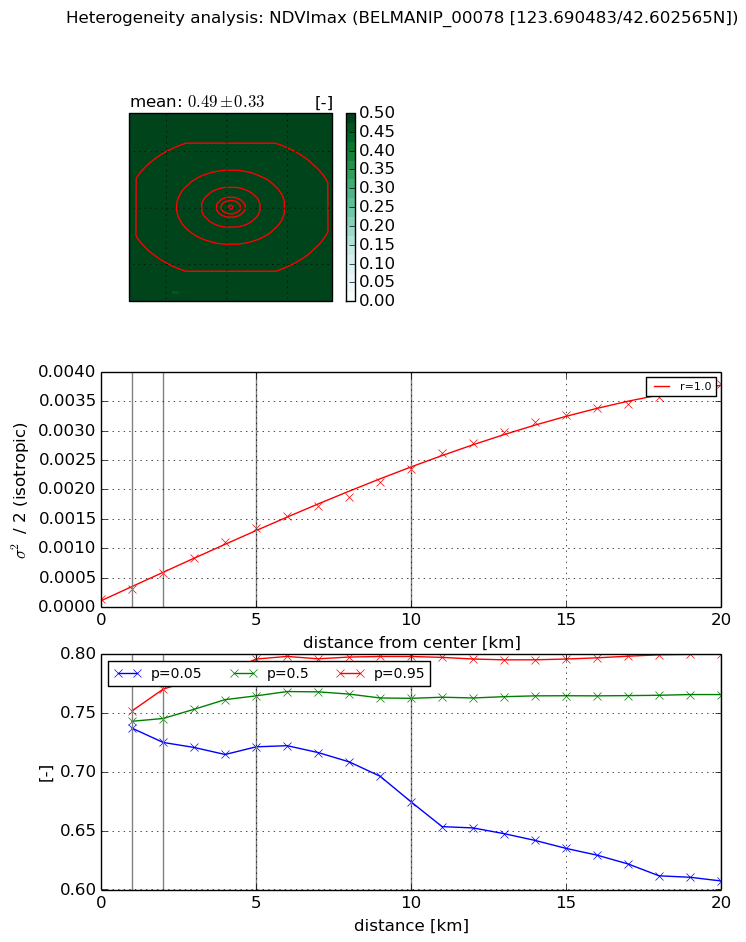
NDVI (max. NDVI composite)


Roman et al. (2009) index


St

7.89701639596

Rcv

0.181701474527

Rse

0.0

Rst

-0.0792293252271

Rsv

0.118959509393


NDVI range @ 1km [-]

0.01

NDVI range @ 2km [-]

0.05

NDVI range @ 5km [-]

0.07

NDVI range @ 10km [-]

0.12

NDVI range @ 20km [-]

0.19


Variance slope @ 1 km

0.000172939174113

Variance slope @ 2 km

0.000218241748835

Variance slope @ 5 km

0.000248127655155

Variance slope @ 10 km

0.000221805148466

Variance slope @ 20 km

0.00018818285209


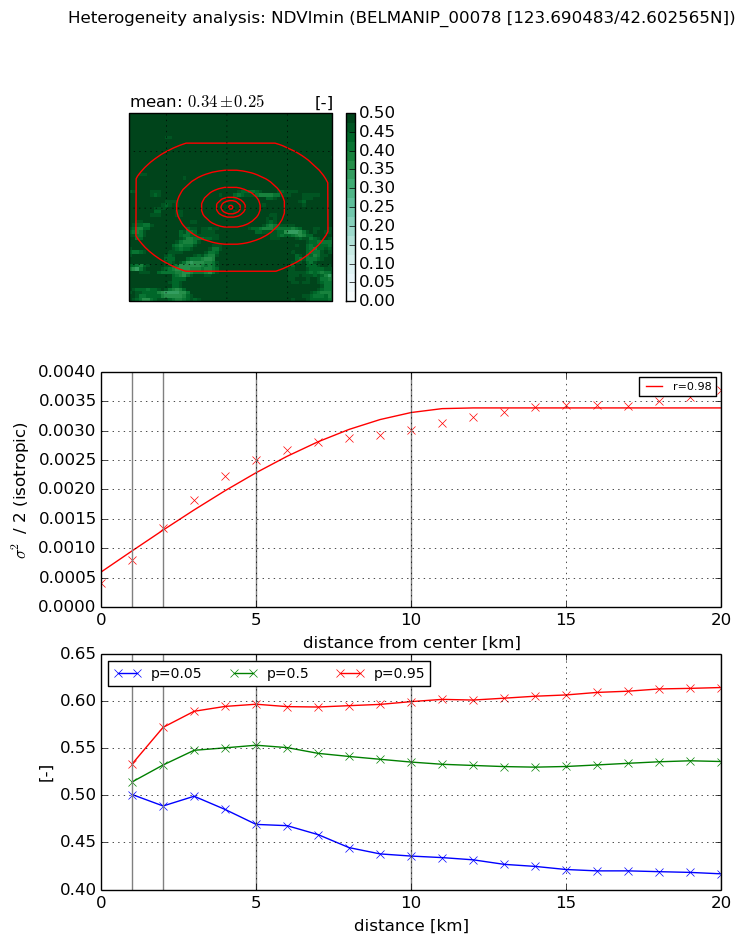
NDVI (min. NDVI composite)I


Roman et al. (2009) index


St

1.35445632584

Rcv

0.370419396111

Rse

0.0

Rst

-0.39400522667

Rsv

1.45048621839


NDVI range @ 1km [-]

0.03

NDVI range @ 2km [-]

0.08

NDVI range @ 5km [-]

0.13

NDVI range @ 10km [-]

0.16

NDVI range @ 20km [-]

0.2


NDVI slope @ 1 km

0.000381040713904

NDVI slope @ 2 km

0.000460783312793

NDVI slope @ 5 km

0.00043392932895

NDVI slope @ 10 km

0.000259563519967

NDVI slope @ 20 km

0.000134301526799


Temporal stability analysis

+000 deg (BHR)


BHR statistics

Temporal stability [1/decade]:


abs

rel


Weighted least square:

None


Ordinary least square:

None


Probabilities that GCOS criteria is met:

Weighted least square:

None %

Ordinary least square:

None %


DHR statistics

Temporal stability [1/decade]:


abs

rel


Weighted least square:

None


Ordinary least square:

None


Probabilities that GCOS criteria is met:

Weighted least square:

None %

Ordinary least square:

None %


+057/+063 deg (BHR)


BHR statistics

Temporal stability [1/decade]:


abs

rel


Weighted least square:

None


Ordinary least square:

None


Probabilities that GCOS criteria is met:

Weighted least square:

None %

Ordinary least square:

None %


DHR statistics

Temporal stability [1/decade]:


abs

rel


Weighted least square:

None


Ordinary least square:

None


Probabilities that GCOS criteria is met:

Weighted least square:

None %

Ordinary least square:

None %


Temporal anomaly analyis

The variance of the temporal anomalies provides an additional measure about the stability of the signal AFTER removal of the mean seasonal cylce.

+000 deg


+057/+063 deg