BELMANIP_00079


Location

lon / lat [deg]: -106.1605 / 40.2214

Source network: BELMANIP


Geostationary surface albedo (GSA) data


“+000”


“+057/+063”


Landcover information (based on ESA CCI landcover data)


Landcover fractions @ 2km distance


Landcover fractions @ 20 km distance


Legend


Distance to open water bodies [km]:

12.85

Distance to urban areas [km]:

7.83


Radius: 1 km

Number of landcover classes:

1

Dominant landcover type:

70: Tree cover, needleleaved, evergreen, closed to open (>15%)

Fraction of dominant landcover type [%]:

100.0


Radius: 2 km

Number of landcover classes:

1

Dominant landcover type:

70: Tree cover, needleleaved, evergreen, closed to open (>15%)

Fraction of dominant landcover type [%]:

100.0


Radius: 5 km

Number of landcover classes:

2

Dominant landcover type:

70: Tree cover, needleleaved, evergreen, closed to open (>15%)

Fraction of dominant landcover type [%]:

98.0


Radius: 10 km

Number of landcover classes:

2

Dominant landcover type:

70: Tree cover, needleleaved, evergreen, closed to open (>15%)

Fraction of dominant landcover type [%]:

97.0


Radius: 20 km

Number of landcover classes:

3

Dominant landcover type:

70: Tree cover, needleleaved, evergreen, closed to open (>15%)

Fraction of dominant landcover type [%]:

78.0


Disturbances


Heterogeneity analysis

The heterogeneity analysis provides information about the spatial and temporal heterogeneity of the site.

Topography


Roman et al. (2009) index


St

2.67227976677

Rcv

0.150609209544

Rse

0.0

Rst

-1.62106666215e-06

Rsv

-0.9720261168


Height range @ 1km [m]

184

Height range @ 2km [m]

409

Height range @ 5km [m]

606

Height range @ 10km [m]

-999

Height range @ 20km [m]

-999


Variance slope @ 1 km

5146

Variance slope @ 2 km

5659

Variance slope @ 5 km

7123

Variance slope @ 10 km

-999

Variance slope @ 20 km

-999


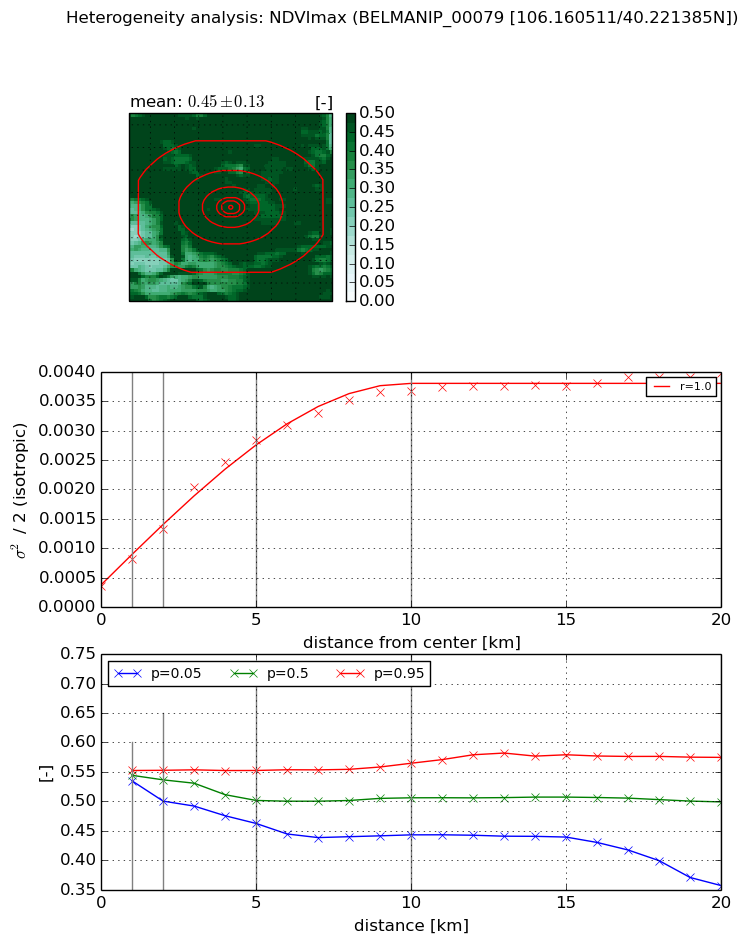
NDVI (max. NDVI composite)


Roman et al. (2009) index


St

4.2384039253

Rcv

0.422608593812

Rse

0.0

Rst

0.111300801421

Rsv

0.173904218777


NDVI range @ 1km [-]

0.02

NDVI range @ 2km [-]

0.05

NDVI range @ 5km [-]

0.09

NDVI range @ 10km [-]

0.12

NDVI range @ 20km [-]

0.22


Variance slope @ 1 km

0.000450347731506

Variance slope @ 2 km

0.000477865570333

Variance slope @ 5 km

0.000515958164206

Variance slope @ 10 km

0.000342344658921

Variance slope @ 20 km

0.000149561141578


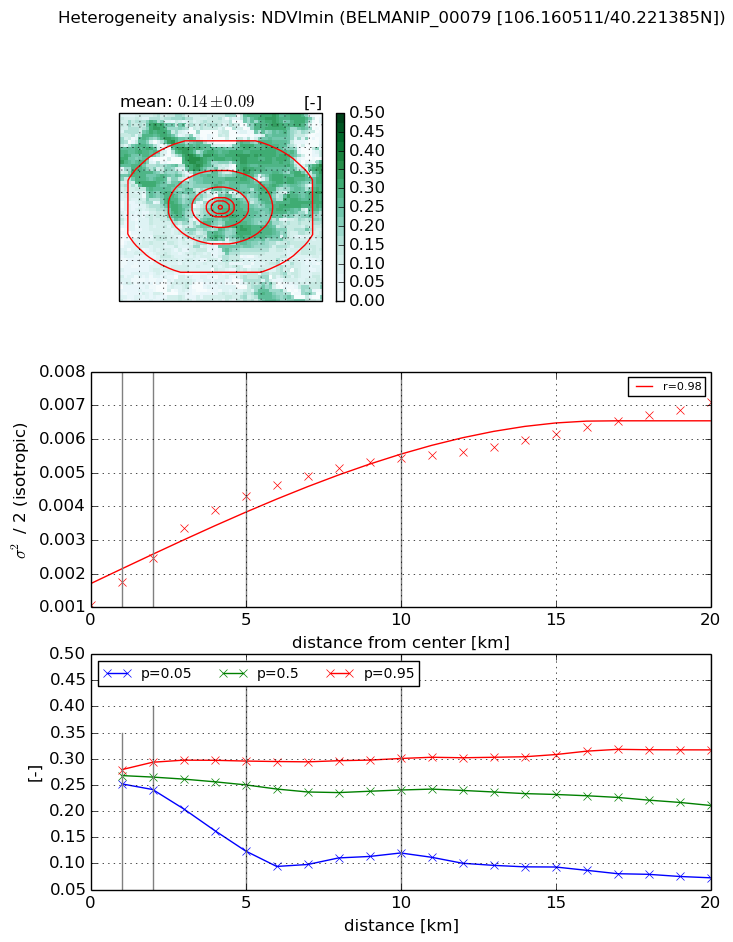
NDVI (min. NDVI composite)I


Roman et al. (2009) index


St

7.28626796477e-08

Rcv

1.29619612337

Rse

0.0

Rst

0.119342537626

Rsv

41173340.1978


NDVI range @ 1km [-]

0.03

NDVI range @ 2km [-]

0.05

NDVI range @ 5km [-]

0.17

NDVI range @ 10km [-]

0.18

NDVI range @ 20km [-]

0.24


NDVI slope @ 1 km

0.000679253667374

NDVI slope @ 2 km

0.00070482950277

NDVI slope @ 5 km

0.000673796235619

NDVI slope @ 10 km

0.000435724771856

NDVI slope @ 20 km

0.000254358395202


Temporal stability analysis

+000 deg (BHR)


BHR statistics

Temporal stability [1/decade]:


abs

rel


Weighted least square:

None


Ordinary least square:

None


Probabilities that GCOS criteria is met:

Weighted least square:

None %

Ordinary least square:

None %


DHR statistics

Temporal stability [1/decade]:


abs

rel


Weighted least square:

None


Ordinary least square:

None


Probabilities that GCOS criteria is met:

Weighted least square:

None %

Ordinary least square:

None %


+057/+063 deg (BHR)


BHR statistics

Temporal stability [1/decade]:


abs

rel


Weighted least square:

None


Ordinary least square:

None


Probabilities that GCOS criteria is met:

Weighted least square:

None %

Ordinary least square:

None %


DHR statistics

Temporal stability [1/decade]:


abs

rel


Weighted least square:

None


Ordinary least square:

None


Probabilities that GCOS criteria is met:

Weighted least square:

None %

Ordinary least square:

None %


Temporal anomaly analyis

The variance of the temporal anomalies provides an additional measure about the stability of the signal AFTER removal of the mean seasonal cylce.

+000 deg


+057/+063 deg