BELMANIP_00082


Location

lon / lat [deg]: -70.4039 / 46.7454

Source network: BELMANIP


Geostationary surface albedo (GSA) data


“+000”


“+057/+063”


Landcover information (based on ESA CCI landcover data)


Landcover fractions @ 2km distance


Landcover fractions @ 20 km distance


Legend


Distance to open water bodies [km]:

7.7

Distance to urban areas [km]:

13.61


Radius: 1 km

Number of landcover classes:

2

Dominant landcover type:

61: Tree cover, broadleaved, decidous (closed > 40%)

Fraction of dominant landcover type [%]:

69.0


Radius: 2 km

Number of landcover classes:

4

Dominant landcover type:

61: Tree cover, broadleaved, decidous (closed > 40%)

Fraction of dominant landcover type [%]:

53.0


Radius: 5 km

Number of landcover classes:

5

Dominant landcover type:

61: Tree cover, broadleaved, decidous (closed > 40%)

Fraction of dominant landcover type [%]:

64.0


Radius: 10 km

Number of landcover classes:

5

Dominant landcover type:

61: Tree cover, broadleaved, decidous (closed > 40%)

Fraction of dominant landcover type [%]:

63.0


Radius: 20 km

Number of landcover classes:

6

Dominant landcover type:

61: Tree cover, broadleaved, decidous (closed > 40%)

Fraction of dominant landcover type [%]:

59.0


Disturbances


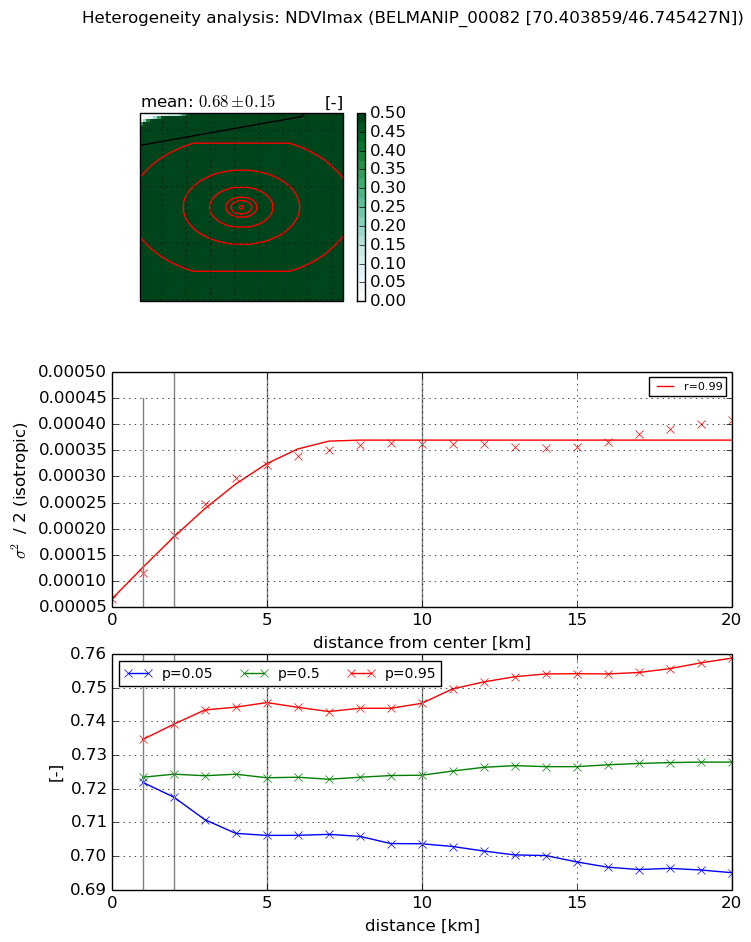
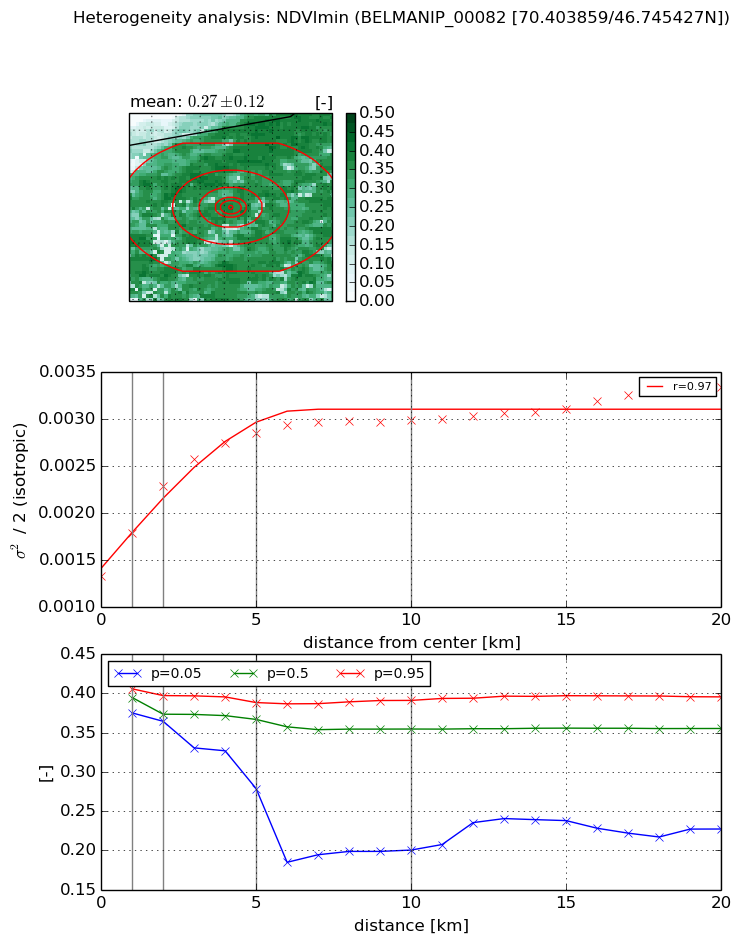
Heterogeneity analysis

The heterogeneity analysis provides information about the spatial and temporal heterogeneity of the site.

Topography


Roman et al. (2009) index


St

8.63303120544

Rcv

0.301910180136

Rse

0.0

Rst

-0.0448936615234

Rsv

0.00069866685811


Height range @ 1km [m]

61

Height range @ 2km [m]

88

Height range @ 5km [m]

125

Height range @ 10km [m]

-999

Height range @ 20km [m]

-999


Variance slope @ 1 km

613

Variance slope @ 2 km

609

Variance slope @ 5 km

408

Variance slope @ 10 km

-999

Variance slope @ 20 km

-999


NDVI (max. NDVI composite)


Roman et al. (2009) index


St

2.69009826358

Rcv

0.214647185326

Rse

0.0

Rst

-0.17175620162

Rsv

0.728797511331


NDVI range @ 1km [-]

0.01

NDVI range @ 2km [-]

0.02

NDVI range @ 5km [-]

0.04

NDVI range @ 10km [-]

0.04

NDVI range @ 20km [-]

0.06


Variance slope @ 1 km

4.90928317204e-05

Variance slope @ 2 km

6.14090043658e-05

Variance slope @ 5 km

5.37533711354e-05

Variance slope @ 10 km

2.93808485976e-05

Variance slope @ 20 km

1.19654400587e-05


NDVI (min. NDVI composite)I


Roman et al. (2009) index


St

0.855349481221

Rcv

1.42610508611

Rse

0.0

Rst

1.06259852097

Rsv

1.01863469833


NDVI range @ 1km [-]

0.03

NDVI range @ 2km [-]

0.03

NDVI range @ 5km [-]

0.11

NDVI range @ 10km [-]

0.19

NDVI range @ 20km [-]

0.17


NDVI slope @ 1 km

0.000457750031558

NDVI slope @ 2 km

0.000478973925549

NDVI slope @ 5 km

0.000308351602502

NDVI slope @ 10 km

0.00014621208802

NDVI slope @ 20 km

6.72743948255e-05


Temporal stability analysis

+000 deg (BHR)


BHR statistics

Temporal stability [1/decade]:


abs

rel


Weighted least square:

-99999.0


Ordinary least square:

-99999.0


Probabilities that GCOS criteria is met:

Weighted least square:

-99999.0 %

Ordinary least square:

-99999.0 %


DHR statistics

Temporal stability [1/decade]:


abs

rel


Weighted least square:

-99999.0


Ordinary least square:

-99999.0


Probabilities that GCOS criteria is met:

Weighted least square:

-99999.0 %

Ordinary least square:

-99999.0 %


+057/+063 deg (BHR)


BHR statistics

Temporal stability [1/decade]:


abs

rel


Weighted least square:

None


Ordinary least square:

None


Probabilities that GCOS criteria is met:

Weighted least square:

None %

Ordinary least square:

None %


DHR statistics

Temporal stability [1/decade]:


abs

rel


Weighted least square:

None


Ordinary least square:

None


Probabilities that GCOS criteria is met:

Weighted least square:

None %

Ordinary least square:

None %


Temporal anomaly analyis

The variance of the temporal anomalies provides an additional measure about the stability of the signal AFTER removal of the mean seasonal cylce.

+000 deg


+057/+063 deg