BELMANIP_00091


Location

lon / lat [deg]: -94.7811 / 41.2516

Source network: BELMANIP


Geostationary surface albedo (GSA) data


“+000”


“+057/+063”


Landcover information (based on ESA CCI landcover data)


Landcover fractions @ 2km distance


Landcover fractions @ 20 km distance


Legend


Distance to open water bodies [km]:

12.31

Distance to urban areas [km]:

18.08


Radius: 1 km

Number of landcover classes:

4

Dominant landcover type:

10: cropland, rainfed

Fraction of dominant landcover type [%]:

82.0


Radius: 2 km

Number of landcover classes:

4

Dominant landcover type:

10: cropland, rainfed

Fraction of dominant landcover type [%]:

63.0


Radius: 5 km

Number of landcover classes:

3

Dominant landcover type:

10: cropland, rainfed

Fraction of dominant landcover type [%]:

65.0


Radius: 10 km

Number of landcover classes:

3

Dominant landcover type:

10: cropland, rainfed

Fraction of dominant landcover type [%]:

70.0


Radius: 20 km

Number of landcover classes:

3

Dominant landcover type:

10: cropland, rainfed

Fraction of dominant landcover type [%]:

68.0


Disturbances


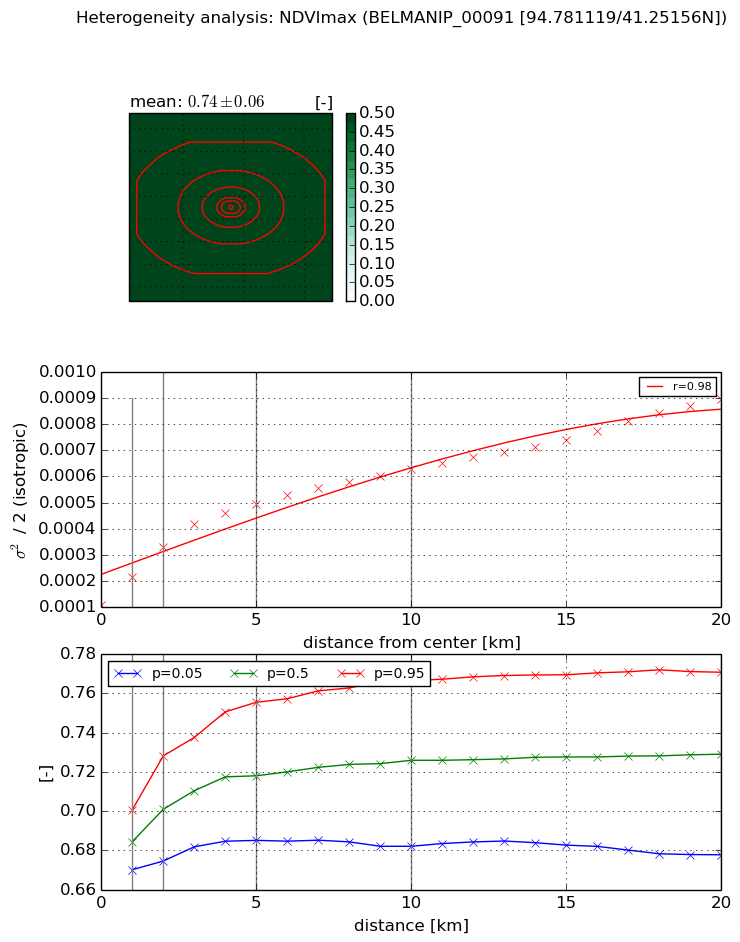
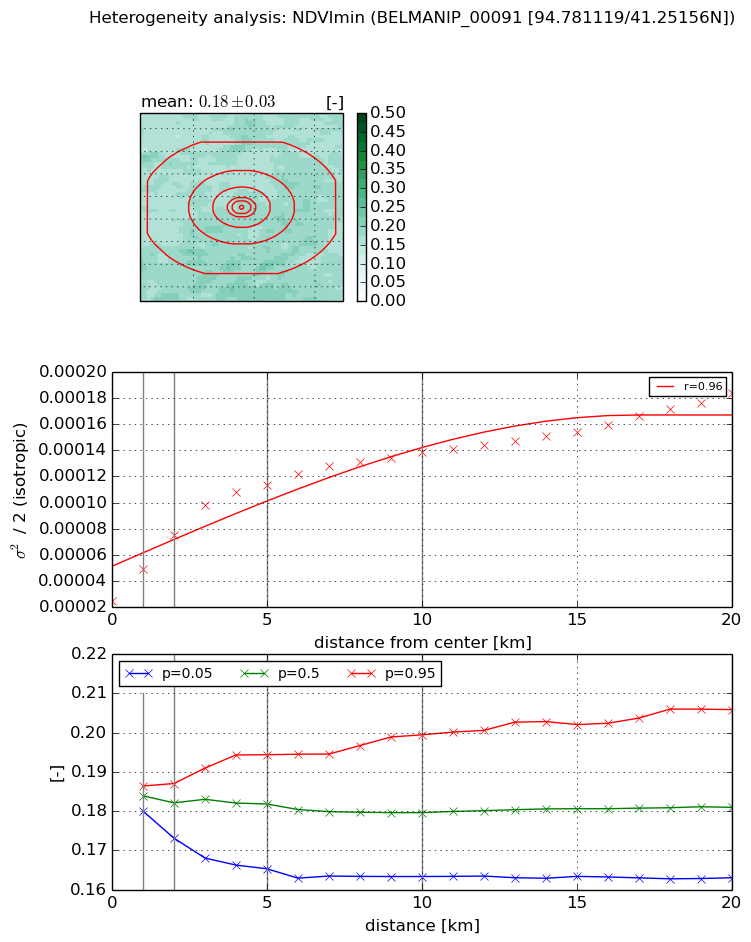
Heterogeneity analysis

The heterogeneity analysis provides information about the spatial and temporal heterogeneity of the site.

Topography


Roman et al. (2009) index


St

4.2152766534

Rcv

0.0438046833766

Rse

0.0

Rst

-0.107641915187

Rsv

0.560250461124


Height range @ 1km [m]

32

Height range @ 2km [m]

37

Height range @ 5km [m]

47

Height range @ 10km [m]

-999

Height range @ 20km [m]

-999


Variance slope @ 1 km

110

Variance slope @ 2 km

84

Variance slope @ 5 km

35

Variance slope @ 10 km

-999

Variance slope @ 20 km

-999


NDVI (max. NDVI composite)


Roman et al. (2009) index


St

0.753786513846

Rcv

-0.0244417074138

Rse

0.0

Rst

-0.726357327576

Rsv

3.22910766922


NDVI range @ 1km [-]

0.03

NDVI range @ 2km [-]

0.05

NDVI range @ 5km [-]

0.07

NDVI range @ 10km [-]

0.08

NDVI range @ 20km [-]

0.09


Variance slope @ 1 km

0.000105184672262

Variance slope @ 2 km

0.000110544237894

Variance slope @ 5 km

7.91517553892e-05

Variance slope @ 10 km

4.77989539395e-05

Variance slope @ 20 km

3.26331085548e-05


NDVI (min. NDVI composite)I


Roman et al. (2009) index


St

3.17207904335e-07

Rcv

0.0655844388826

Rse

0.0

Rst

0.377180239401

Rsv

9457519.24387


NDVI range @ 1km [-]

0.01

NDVI range @ 2km [-]

0.01

NDVI range @ 5km [-]

0.03

NDVI range @ 10km [-]

0.04

NDVI range @ 20km [-]

0.04


NDVI slope @ 1 km

2.4630202957e-05

NDVI slope @ 2 km

2.53170620176e-05

NDVI slope @ 5 km

1.83878683497e-05

NDVI slope @ 10 km

1.04625754446e-05

NDVI slope @ 20 km

6.10688089019e-06


Temporal stability analysis

+000 deg (BHR)


BHR statistics

Temporal stability [1/decade]:


abs

rel


Weighted least square:

None


Ordinary least square:

None


Probabilities that GCOS criteria is met:

Weighted least square:

None %

Ordinary least square:

None %


DHR statistics

Temporal stability [1/decade]:


abs

rel


Weighted least square:

None


Ordinary least square:

None


Probabilities that GCOS criteria is met:

Weighted least square:

None %

Ordinary least square:

None %


+057/+063 deg (BHR)


BHR statistics

Temporal stability [1/decade]:


abs

rel


Weighted least square:

None


Ordinary least square:

None


Probabilities that GCOS criteria is met:

Weighted least square:

None %

Ordinary least square:

None %


DHR statistics

Temporal stability [1/decade]:


abs

rel


Weighted least square:

None


Ordinary least square:

None


Probabilities that GCOS criteria is met:

Weighted least square:

None %

Ordinary least square:

None %


Temporal anomaly analyis

The variance of the temporal anomalies provides an additional measure about the stability of the signal AFTER removal of the mean seasonal cylce.

+000 deg


+057/+063 deg