BELMANIP_00099


Location

lon / lat [deg]: -118.5214 / 57.6586

Source network: BELMANIP


Geostationary surface albedo (GSA) data


“+000”


“+057/+063”


Landcover information (based on ESA CCI landcover data)


Landcover fractions @ 2km distance


Landcover fractions @ 20 km distance


Legend


Distance to open water bodies [km]:

16.81

Distance to urban areas [km]:

none in region


Radius: 1 km

Number of landcover classes:

1

Dominant landcover type:

70: Tree cover, needleleaved, evergreen, closed to open (>15%)

Fraction of dominant landcover type [%]:

100.0


Radius: 2 km

Number of landcover classes:

2

Dominant landcover type:

70: Tree cover, needleleaved, evergreen, closed to open (>15%)

Fraction of dominant landcover type [%]:

99.0


Radius: 5 km

Number of landcover classes:

3

Dominant landcover type:

70: Tree cover, needleleaved, evergreen, closed to open (>15%)

Fraction of dominant landcover type [%]:

97.0


Radius: 10 km

Number of landcover classes:

6

Dominant landcover type:

70: Tree cover, needleleaved, evergreen, closed to open (>15%)

Fraction of dominant landcover type [%]:

82.0


Radius: 20 km

Number of landcover classes:

6

Dominant landcover type:

70: Tree cover, needleleaved, evergreen, closed to open (>15%)

Fraction of dominant landcover type [%]:

66.0


Disturbances


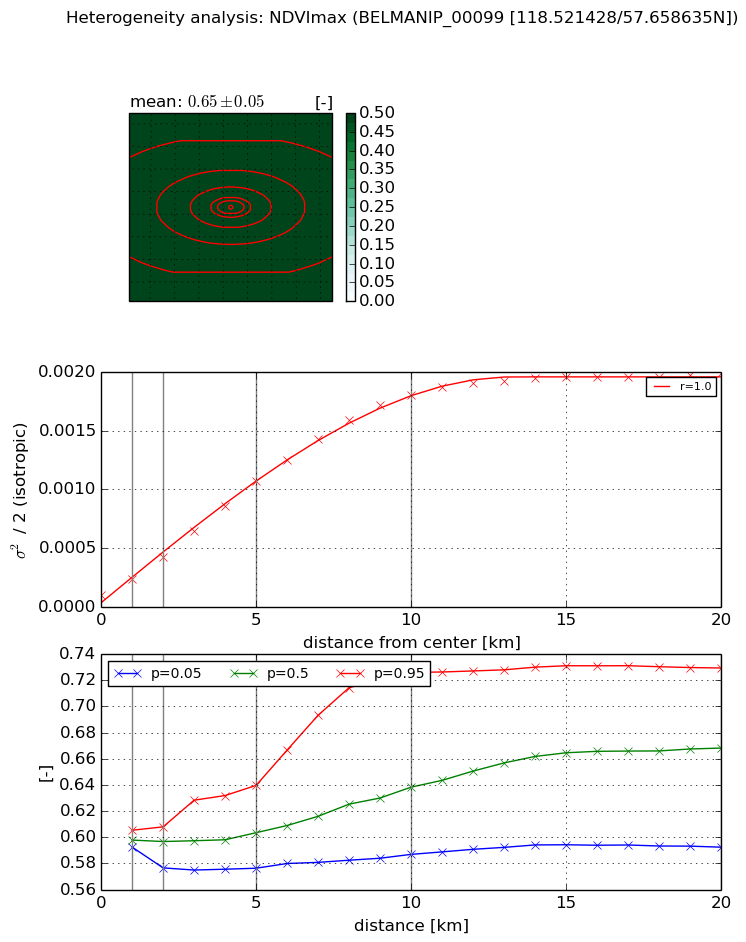
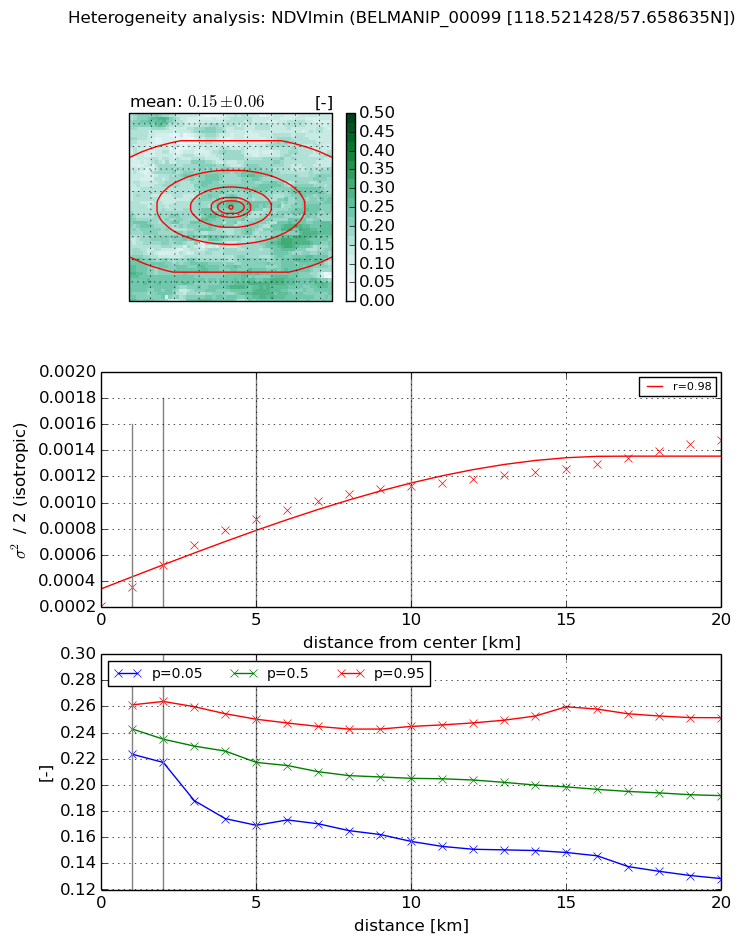
Heterogeneity analysis

The heterogeneity analysis provides information about the spatial and temporal heterogeneity of the site.

Topography


Roman et al. (2009) index


St

0.673767272038

Rcv

0.72230945606

Rse

0.0

Rst

3.65829817565e-06

Rsv

3.73026290781


Height range @ 1km [m]

16

Height range @ 2km [m]

31

Height range @ 5km [m]

78

Height range @ 10km [m]

-999

Height range @ 20km [m]

-999


Variance slope @ 1 km

74

Variance slope @ 2 km

106

Variance slope @ 5 km

138

Variance slope @ 10 km

-999

Variance slope @ 20 km

-999


NDVI (max. NDVI composite)


Roman et al. (2009) index


St

4.91089599887e-07

Rcv

0.192135689859

Rse

0.0

Rst

0.140393912601

Rsv

6108864.52775


NDVI range @ 1km [-]

0.01

NDVI range @ 2km [-]

0.03

NDVI range @ 5km [-]

0.06

NDVI range @ 10km [-]

0.14

NDVI range @ 20km [-]

0.14


Variance slope @ 1 km

0.000135408035292

Variance slope @ 2 km

0.000160722795541

Variance slope @ 5 km

0.000198294160674

Variance slope @ 10 km

0.000180402807964

Variance slope @ 20 km

9.34480309391e-05


NDVI (min. NDVI composite)I


Roman et al. (2009) index


St

4.4739204184

Rcv

0.370254887007

Rse

0.0

Rst

0.132571523254

Rsv

-0.16772642024


NDVI range @ 1km [-]

0.04

NDVI range @ 2km [-]

0.05

NDVI range @ 5km [-]

0.08

NDVI range @ 10km [-]

0.09

NDVI range @ 20km [-]

0.12


NDVI slope @ 1 km

0.000151342963019

NDVI slope @ 2 km

0.000159352084234

NDVI slope @ 5 km

0.000137063708176

NDVI slope @ 10 km

9.09428624736e-05

NDVI slope @ 20 km

5.33903747789e-05


Temporal stability analysis

+000 deg (BHR)


BHR statistics

Temporal stability [1/decade]:


abs

rel


Weighted least square:

None


Ordinary least square:

None


Probabilities that GCOS criteria is met:

Weighted least square:

None %

Ordinary least square:

None %


DHR statistics

Temporal stability [1/decade]:


abs

rel


Weighted least square:

None


Ordinary least square:

None


Probabilities that GCOS criteria is met:

Weighted least square:

None %

Ordinary least square:

None %


+057/+063 deg (BHR)


BHR statistics

Temporal stability [1/decade]:


abs

rel


Weighted least square:

None


Ordinary least square:

None


Probabilities that GCOS criteria is met:

Weighted least square:

None %

Ordinary least square:

None %


DHR statistics

Temporal stability [1/decade]:


abs

rel


Weighted least square:

None


Ordinary least square:

None


Probabilities that GCOS criteria is met:

Weighted least square:

None %

Ordinary least square:

None %


Temporal anomaly analyis

The variance of the temporal anomalies provides an additional measure about the stability of the signal AFTER removal of the mean seasonal cylce.

+000 deg


+057/+063 deg