BELMANIP_00110


Location

lon / lat [deg]: -121.3097 / 62.2918

Source network: BELMANIP


Geostationary surface albedo (GSA) data


“+000”


“+057/+063”


Landcover information (based on ESA CCI landcover data)


Landcover fractions @ 2km distance


Landcover fractions @ 20 km distance


Legend


Distance to open water bodies [km]:

8.08

Distance to urban areas [km]:

47.62


Radius: 1 km

Number of landcover classes:

5

Dominant landcover type:

100: Mosaic tree and shrub (>50%) / herbaceous cover (<50%)

Fraction of dominant landcover type [%]:

70.0


Radius: 2 km

Number of landcover classes:

5

Dominant landcover type:

100: Mosaic tree and shrub (>50%) / herbaceous cover (<50%)

Fraction of dominant landcover type [%]:

32.0


Radius: 5 km

Number of landcover classes:

5

Dominant landcover type:

100: Mosaic tree and shrub (>50%) / herbaceous cover (<50%)

Fraction of dominant landcover type [%]:

29.0


Radius: 10 km

Number of landcover classes:

5

Dominant landcover type:

130: grassland

Fraction of dominant landcover type [%]:

39.0


Radius: 20 km

Number of landcover classes:

6

Dominant landcover type:

130: grassland

Fraction of dominant landcover type [%]:

36.0


Disturbances


Heterogeneity analysis

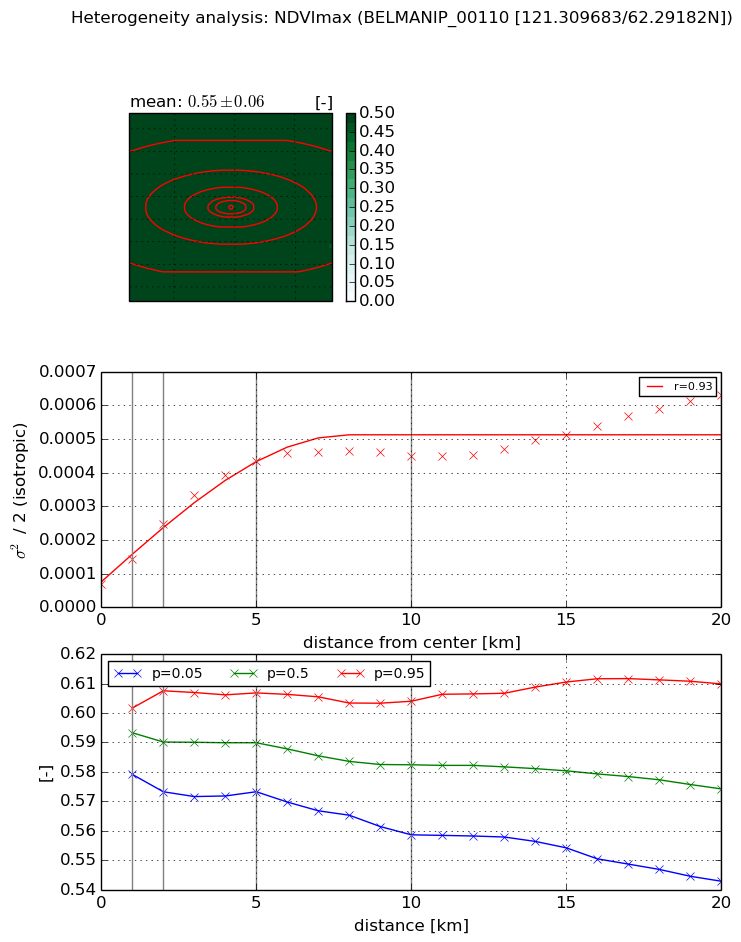
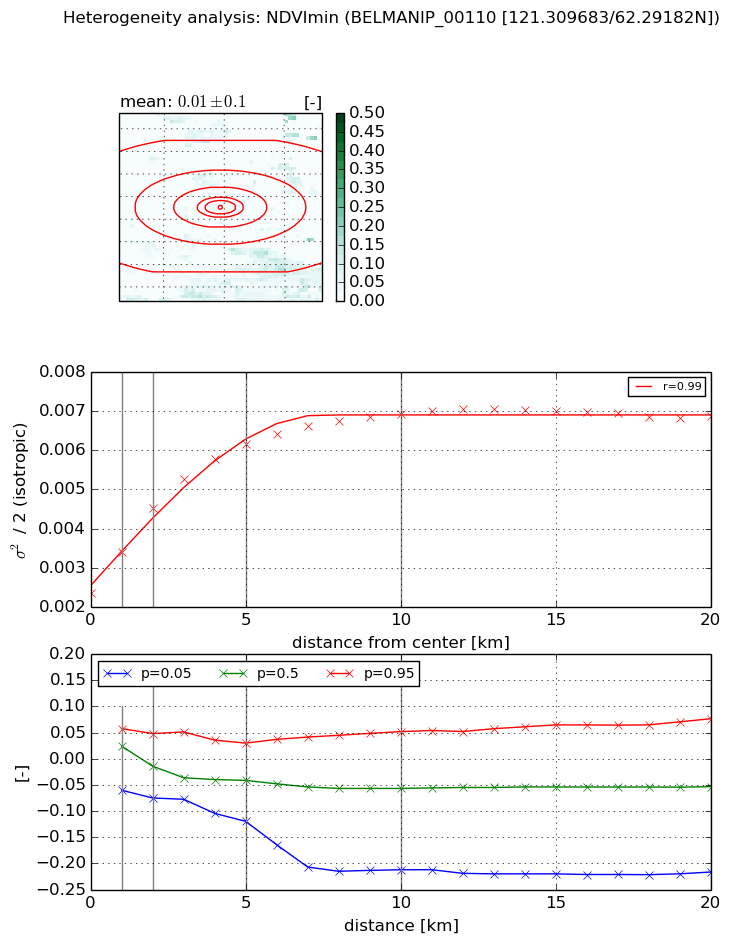
The heterogeneity analysis provides information about the spatial and temporal heterogeneity of the site.

Topography


Roman et al. (2009) index


St

0.00044706598835

Rcv

0.410605596911

Rse

0.0

Rst

4.92475267823e-05

Rsv

6710.00811593


Height range @ 1km [m]

8

Height range @ 2km [m]

16

Height range @ 5km [m]

34

Height range @ 10km [m]

-999

Height range @ 20km [m]

-999


Variance slope @ 1 km

9

Variance slope @ 2 km

14

Variance slope @ 5 km

22

Variance slope @ 10 km

-999

Variance slope @ 20 km

-999


NDVI (max. NDVI composite)


Roman et al. (2009) index


St

10.3983774828

Rcv

-0.106048047881

Rse

0.0

Rst

-0.075834032532

Rsv

-0.106624468322


NDVI range @ 1km [-]

0.02

NDVI range @ 2km [-]

0.03

NDVI range @ 5km [-]

0.03

NDVI range @ 10km [-]

0.05

NDVI range @ 20km [-]

0.07


Variance slope @ 1 km

7.4577851268e-05

Variance slope @ 2 km

8.88611065633e-05

Variance slope @ 5 km

7.61085064884e-05

Variance slope @ 10 km

3.77885064325e-05

Variance slope @ 20 km

2.03454239104e-05


NDVI (min. NDVI composite)I


Roman et al. (2009) index


St

2.38550214953

Rcv

-0.408008423251

Rse

0.0

Rst

0.294463152601

Rsv

-0.555125278796


NDVI range @ 1km [-]

0.12

NDVI range @ 2km [-]

0.12

NDVI range @ 5km [-]

0.15

NDVI range @ 10km [-]

0.26

NDVI range @ 20km [-]

0.29


NDVI slope @ 1 km

0.00104647100072

NDVI slope @ 2 km

0.00108346827201

NDVI slope @ 5 km

0.000769385136442

NDVI slope @ 10 km

0.00042438580576

NDVI slope @ 20 km

0.000159124185467


Temporal stability analysis

+000 deg (BHR)


BHR statistics

Temporal stability [1/decade]:


abs

rel


Weighted least square:

None


Ordinary least square:

None


Probabilities that GCOS criteria is met:

Weighted least square:

None %

Ordinary least square:

None %


DHR statistics

Temporal stability [1/decade]:


abs

rel


Weighted least square:

None


Ordinary least square:

None


Probabilities that GCOS criteria is met:

Weighted least square:

None %

Ordinary least square:

None %


+057/+063 deg (BHR)


BHR statistics

Temporal stability [1/decade]:


abs

rel


Weighted least square:

None


Ordinary least square:

None


Probabilities that GCOS criteria is met:

Weighted least square:

None %

Ordinary least square:

None %


DHR statistics

Temporal stability [1/decade]:


abs

rel


Weighted least square:

None


Ordinary least square:

None


Probabilities that GCOS criteria is met:

Weighted least square:

None %

Ordinary least square:

None %


Temporal anomaly analyis

The variance of the temporal anomalies provides an additional measure about the stability of the signal AFTER removal of the mean seasonal cylce.

+000 deg


+057/+063 deg