BELMANIP_00112


Location

lon / lat [deg]: -163.9557 / 61.3824

Source network: BELMANIP


Geostationary surface albedo (GSA) data


“+000”


“+057/+063”


Landcover information (based on ESA CCI landcover data)


Landcover fractions @ 2km distance


Landcover fractions @ 20 km distance


Legend


Distance to open water bodies [km]:

4.24

Distance to urban areas [km]:

none in region


Radius: 1 km

Number of landcover classes:

2

Dominant landcover type:

150: Sparse vegetation (tree, shrub, herbaceous cover) (<15%)

Fraction of dominant landcover type [%]:

93.0


Radius: 2 km

Number of landcover classes:

2

Dominant landcover type:

150: Sparse vegetation (tree, shrub, herbaceous cover) (<15%)

Fraction of dominant landcover type [%]:

78.0


Radius: 5 km

Number of landcover classes:

3

Dominant landcover type:

150: Sparse vegetation (tree, shrub, herbaceous cover) (<15%)

Fraction of dominant landcover type [%]:

76.0


Radius: 10 km

Number of landcover classes:

4

Dominant landcover type:

150: Sparse vegetation (tree, shrub, herbaceous cover) (<15%)

Fraction of dominant landcover type [%]:

83.0


Radius: 20 km

Number of landcover classes:

4

Dominant landcover type:

150: Sparse vegetation (tree, shrub, herbaceous cover) (<15%)

Fraction of dominant landcover type [%]:

83.0


Disturbances


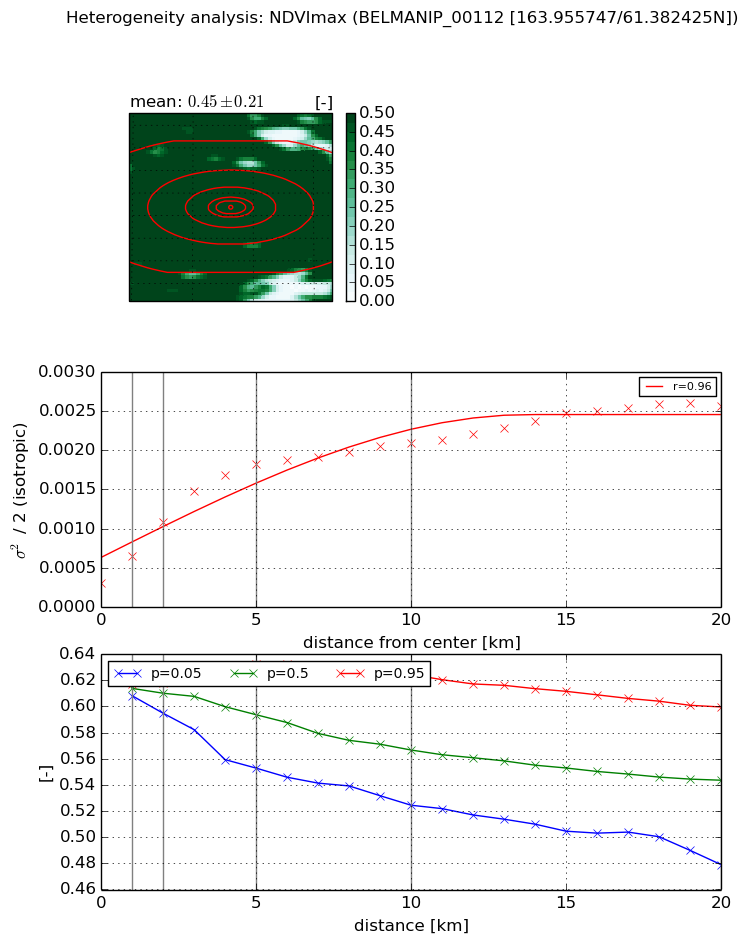
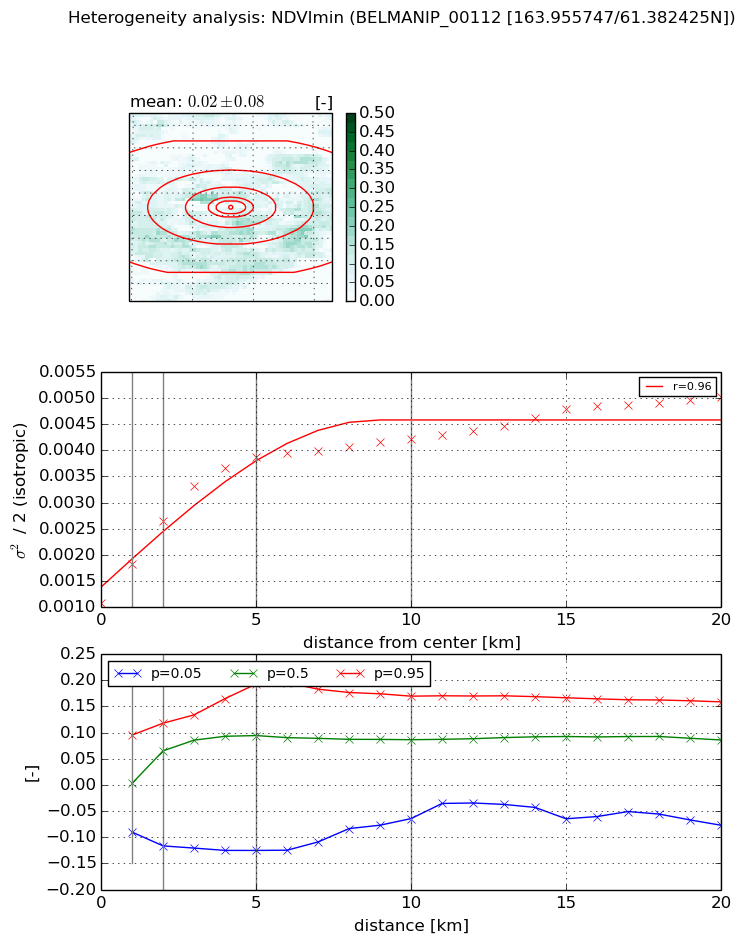
Heterogeneity analysis

The heterogeneity analysis provides information about the spatial and temporal heterogeneity of the site.

Topography


Roman et al. (2009) index


St

9.56124318124

Rcv

0.185884707847

Rse

0.0

Rst

9.28384124451e-07

Rsv

0.127881092962


Height range @ 1km [m]

42

Height range @ 2km [m]

65

Height range @ 5km [m]

75

Height range @ 10km [m]

-999

Height range @ 20km [m]

-999


Variance slope @ 1 km

112

Variance slope @ 2 km

126

Variance slope @ 5 km

145

Variance slope @ 10 km

-999

Variance slope @ 20 km

-999


NDVI (max. NDVI composite)


Roman et al. (2009) index


St

3.55145187478

Rcv

0.678914850152

Rse

0.0

Rst

-0.0455058302929

Rsv

0.120304267487


NDVI range @ 1km [-]

0.01

NDVI range @ 2km [-]

0.02

NDVI range @ 5km [-]

0.08

NDVI range @ 10km [-]

0.1

NDVI range @ 20km [-]

0.12


Variance slope @ 1 km

0.000350438044207

Variance slope @ 2 km

0.000391150311548

Variance slope @ 5 km

0.0003151298764

Variance slope @ 10 km

0.000166206192165

Variance slope @ 20 km

9.26882427882e-05


NDVI (min. NDVI composite)I


Roman et al. (2009) index


St

7.4145788135

Rcv

-0.332232410017

Rse

0.0

Rst

-0.00591835107853

Rsv

0.0664575215135


NDVI range @ 1km [-]

0.19

NDVI range @ 2km [-]

0.23

NDVI range @ 5km [-]

0.32

NDVI range @ 10km [-]

0.23

NDVI range @ 20km [-]

0.24


NDVI slope @ 1 km

0.000737918604098

NDVI slope @ 2 km

0.000776430516667

NDVI slope @ 5 km

0.000573131762314

NDVI slope @ 10 km

0.000280994071996

NDVI slope @ 20 km

0.000146651462081


Temporal stability analysis

+000 deg (BHR)


BHR statistics

Temporal stability [1/decade]:


abs

rel


Weighted least square:

None


Ordinary least square:

None


Probabilities that GCOS criteria is met:

Weighted least square:

None %

Ordinary least square:

None %


DHR statistics

Temporal stability [1/decade]:


abs

rel


Weighted least square:

None


Ordinary least square:

None


Probabilities that GCOS criteria is met:

Weighted least square:

None %

Ordinary least square:

None %


+057/+063 deg (BHR)


BHR statistics

Temporal stability [1/decade]:


abs

rel


Weighted least square:

None


Ordinary least square:

None


Probabilities that GCOS criteria is met:

Weighted least square:

None %

Ordinary least square:

None %


DHR statistics

Temporal stability [1/decade]:


abs

rel


Weighted least square:

None


Ordinary least square:

None


Probabilities that GCOS criteria is met:

Weighted least square:

None %

Ordinary least square:

None %


Temporal anomaly analyis

The variance of the temporal anomalies provides an additional measure about the stability of the signal AFTER removal of the mean seasonal cylce.

+000 deg


+057/+063 deg