BELMANIP_00113


Location

lon / lat [deg]: -158.7894 / 68.9221

Source network: BELMANIP


Geostationary surface albedo (GSA) data


“+000”


“+057/+063”


Landcover information (based on ESA CCI landcover data)


Landcover fractions @ 2km distance


Landcover fractions @ 20 km distance


Legend


Distance to open water bodies [km]:

12.33

Distance to urban areas [km]:

none in region


Radius: 1 km

Number of landcover classes:

1

Dominant landcover type:

150: Sparse vegetation (tree, shrub, herbaceous cover) (<15%)

Fraction of dominant landcover type [%]:

100.0


Radius: 2 km

Number of landcover classes:

1

Dominant landcover type:

150: Sparse vegetation (tree, shrub, herbaceous cover) (<15%)

Fraction of dominant landcover type [%]:

99.0


Radius: 5 km

Number of landcover classes:

1

Dominant landcover type:

150: Sparse vegetation (tree, shrub, herbaceous cover) (<15%)

Fraction of dominant landcover type [%]:

100.0


Radius: 10 km

Number of landcover classes:

1

Dominant landcover type:

150: Sparse vegetation (tree, shrub, herbaceous cover) (<15%)

Fraction of dominant landcover type [%]:

100.0


Radius: 20 km

Number of landcover classes:

1

Dominant landcover type:

150: Sparse vegetation (tree, shrub, herbaceous cover) (<15%)

Fraction of dominant landcover type [%]:

99.0


Disturbances


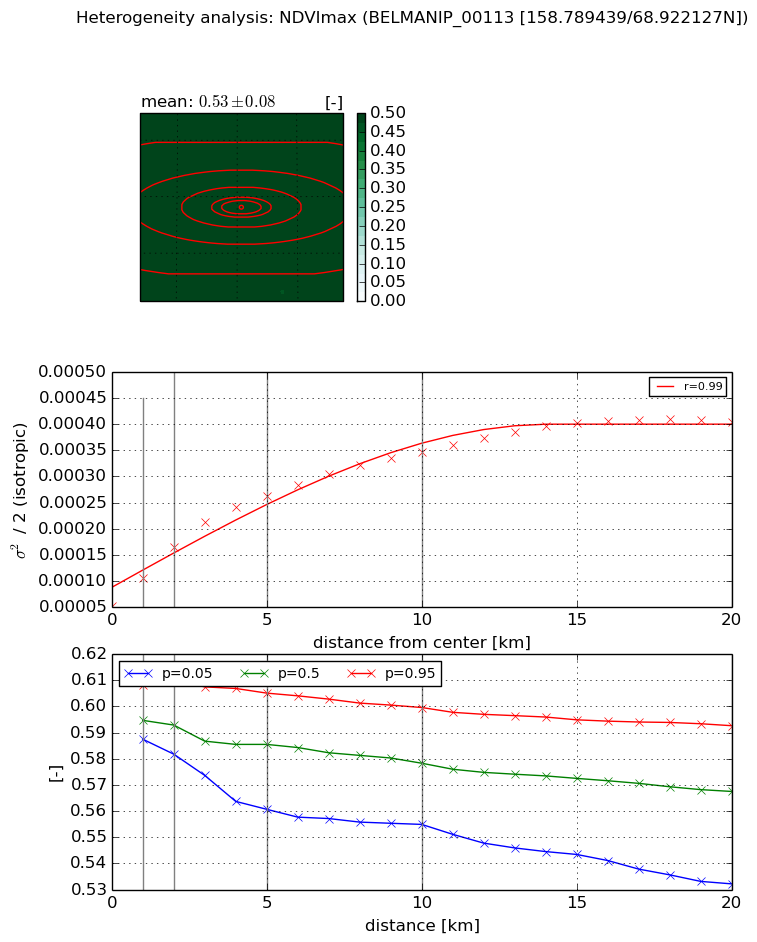
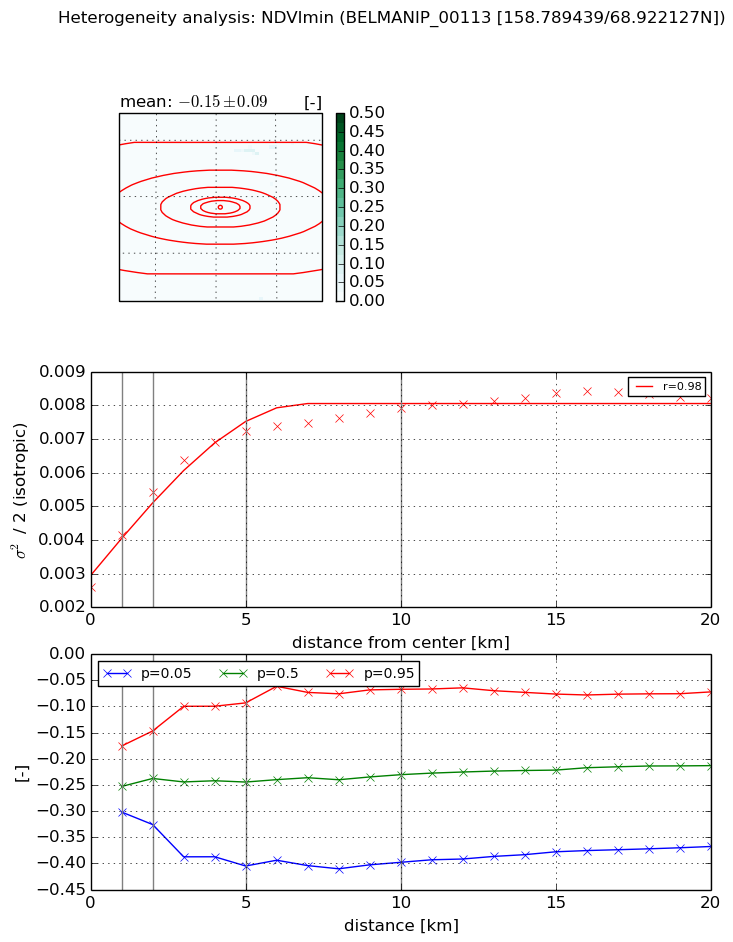
Heterogeneity analysis

The heterogeneity analysis provides information about the spatial and temporal heterogeneity of the site.

Topography


Roman et al. (2009) index


St

0.25675006459

Rcv

0.0755414738984

Rse

0.0

Rst

3.55785575826e-06

Rsv

11.6089700424


Height range @ 1km [m]

91

Height range @ 2km [m]

128

Height range @ 5km [m]

162

Height range @ 10km [m]

-999

Height range @ 20km [m]

-999


Variance slope @ 1 km

434

Variance slope @ 2 km

588

Variance slope @ 5 km

630

Variance slope @ 10 km

-999

Variance slope @ 20 km

-999


NDVI (max. NDVI composite)


Roman et al. (2009) index


St

4.44264655841

Rcv

0.200862097006

Rse

0.0

Rst

-0.0745549451853

Rsv

0.399856122252


NDVI range @ 1km [-]

0.02

NDVI range @ 2km [-]

0.03

NDVI range @ 5km [-]

0.04

NDVI range @ 10km [-]

0.04

NDVI range @ 20km [-]

0.06


Variance slope @ 1 km

5.35413605992e-05

Variance slope @ 2 km

5.63670836637e-05

Variance slope @ 5 km

4.2857633507e-05

Variance slope @ 10 km

2.80536531092e-05

Variance slope @ 20 km

1.56653946827e-05


NDVI (min. NDVI composite)I


Roman et al. (2009) index


St

2.78654334468

Rcv

0.0590696436142

Rse

0.0

Rst

-0.0175332237724

Rsv

-0.999999800835


NDVI range @ 1km [-]

0.13

NDVI range @ 2km [-]

0.18

NDVI range @ 5km [-]

0.31

NDVI range @ 10km [-]

0.33

NDVI range @ 20km [-]

0.3


NDVI slope @ 1 km

0.00153517928334

NDVI slope @ 2 km

0.00140695426897

NDVI slope @ 5 km

0.000926663022447

NDVI slope @ 10 km

0.000458049537281

NDVI slope @ 20 km

0.000197463974912


Temporal stability analysis

+000 deg (BHR)


BHR statistics

Temporal stability [1/decade]:


abs

rel


Weighted least square:

None


Ordinary least square:

None


Probabilities that GCOS criteria is met:

Weighted least square:

None %

Ordinary least square:

None %


DHR statistics

Temporal stability [1/decade]:


abs

rel


Weighted least square:

None


Ordinary least square:

None


Probabilities that GCOS criteria is met:

Weighted least square:

None %

Ordinary least square:

None %


+057/+063 deg (BHR)


BHR statistics

Temporal stability [1/decade]:


abs

rel


Weighted least square:

None


Ordinary least square:

None


Probabilities that GCOS criteria is met:

Weighted least square:

None %

Ordinary least square:

None %


DHR statistics

Temporal stability [1/decade]:


abs

rel


Weighted least square:

None


Ordinary least square:

None


Probabilities that GCOS criteria is met:

Weighted least square:

None %

Ordinary least square:

None %


Temporal anomaly analyis

The variance of the temporal anomalies provides an additional measure about the stability of the signal AFTER removal of the mean seasonal cylce.

+000 deg


+057/+063 deg