BELMANIP_00114


Location

lon / lat [deg]: -145.4623 / 67.9168

Source network: BELMANIP


Geostationary surface albedo (GSA) data


“+000”


“+057/+063”


Landcover information (based on ESA CCI landcover data)


Landcover fractions @ 2km distance


Landcover fractions @ 20 km distance


Legend


Distance to open water bodies [km]:

15.62

Distance to urban areas [km]:

none in region


Radius: 1 km

Number of landcover classes:

2

Dominant landcover type:

150: Sparse vegetation (tree, shrub, herbaceous cover) (<15%)

Fraction of dominant landcover type [%]:

97.0


Radius: 2 km

Number of landcover classes:

2

Dominant landcover type:

150: Sparse vegetation (tree, shrub, herbaceous cover) (<15%)

Fraction of dominant landcover type [%]:

95.0


Radius: 5 km

Number of landcover classes:

3

Dominant landcover type:

150: Sparse vegetation (tree, shrub, herbaceous cover) (<15%)

Fraction of dominant landcover type [%]:

95.0


Radius: 10 km

Number of landcover classes:

3

Dominant landcover type:

150: Sparse vegetation (tree, shrub, herbaceous cover) (<15%)

Fraction of dominant landcover type [%]:

90.0


Radius: 20 km

Number of landcover classes:

4

Dominant landcover type:

150: Sparse vegetation (tree, shrub, herbaceous cover) (<15%)

Fraction of dominant landcover type [%]:

83.0


Disturbances


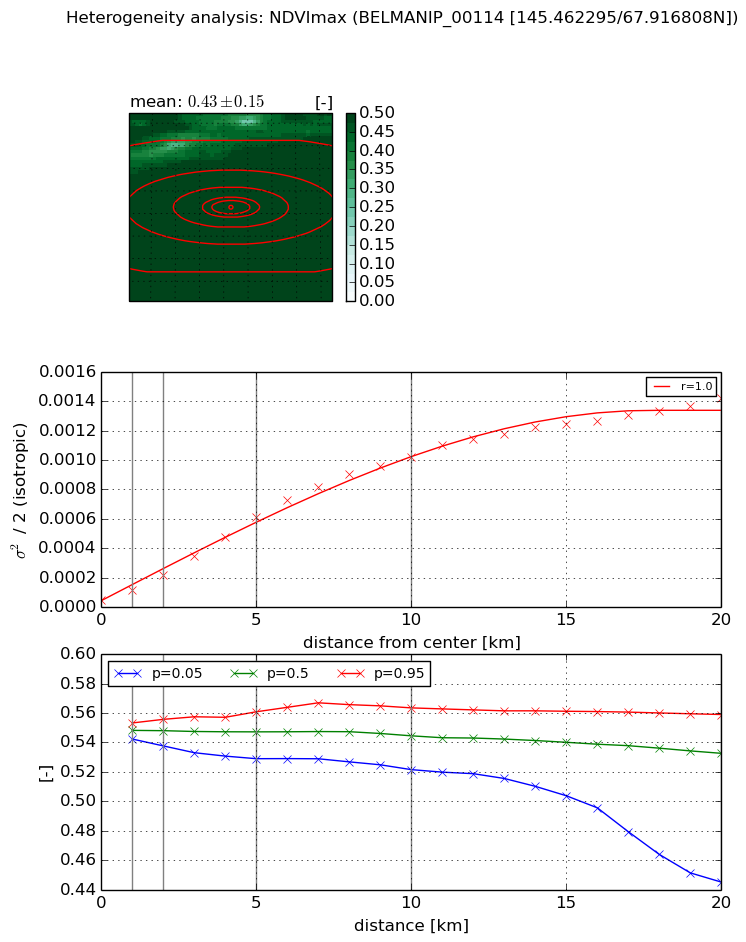
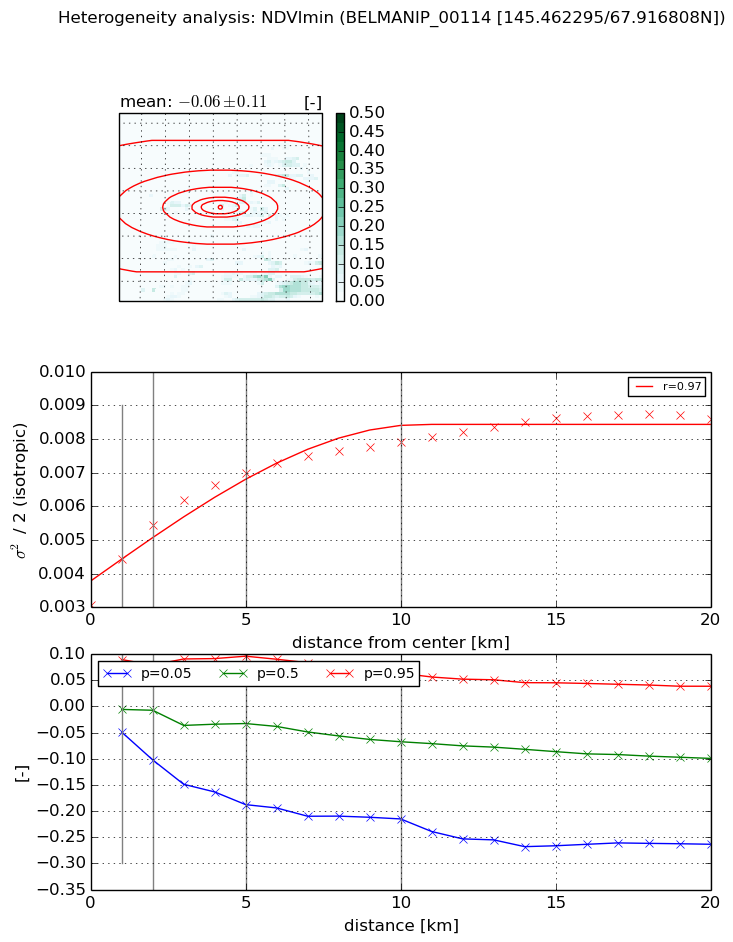
Heterogeneity analysis

The heterogeneity analysis provides information about the spatial and temporal heterogeneity of the site.

Topography


Roman et al. (2009) index


St

4.22681250733

Rcv

0.385513872385

Rse

0.0

Rst

0.0411154416102

Rsv

0.28312537581


Height range @ 1km [m]

65

Height range @ 2km [m]

117

Height range @ 5km [m]

159

Height range @ 10km [m]

-999

Height range @ 20km [m]

-999


Variance slope @ 1 km

716

Variance slope @ 2 km

811

Variance slope @ 5 km

767

Variance slope @ 10 km

-999

Variance slope @ 20 km

-999


NDVI (max. NDVI composite)


Roman et al. (2009) index


St

3.45701627661

Rcv

0.236588051161

Rse

0.0

Rst

-0.0438691116111

Rsv

0.58734320609


NDVI range @ 1km [-]

0.01

NDVI range @ 2km [-]

0.02

NDVI range @ 5km [-]

0.03

NDVI range @ 10km [-]

0.04

NDVI range @ 20km [-]

0.11


Variance slope @ 1 km

6.74606614112e-05

Variance slope @ 2 km

8.48558514394e-05

Variance slope @ 5 km

0.000115091467692

Variance slope @ 10 km

0.000103997195098

Variance slope @ 20 km

6.7888109787e-05


NDVI (min. NDVI composite)I


Roman et al. (2009) index


St

0.000152313469065

Rcv

0.134207464231

Rse

0.0

Rst

-0.000611019245192

Rsv

19696.0878361


NDVI range @ 1km [-]

0.14

NDVI range @ 2km [-]

0.18

NDVI range @ 5km [-]

0.28

NDVI range @ 10km [-]

0.28

NDVI range @ 20km [-]

0.3


NDVI slope @ 1 km

0.00137993233471

NDVI slope @ 2 km

0.00119366641148

NDVI slope @ 5 km

0.000773190189864

NDVI slope @ 10 km

0.000431658811858

NDVI slope @ 20 km

0.000217571581321


Temporal stability analysis

+000 deg (BHR)


BHR statistics

Temporal stability [1/decade]:


abs

rel


Weighted least square:

None


Ordinary least square:

None


Probabilities that GCOS criteria is met:

Weighted least square:

None %

Ordinary least square:

None %


DHR statistics

Temporal stability [1/decade]:


abs

rel


Weighted least square:

None


Ordinary least square:

None


Probabilities that GCOS criteria is met:

Weighted least square:

None %

Ordinary least square:

None %


+057/+063 deg (BHR)


BHR statistics

Temporal stability [1/decade]:


abs

rel


Weighted least square:

None


Ordinary least square:

None


Probabilities that GCOS criteria is met:

Weighted least square:

None %

Ordinary least square:

None %


DHR statistics

Temporal stability [1/decade]:


abs

rel


Weighted least square:

None


Ordinary least square:

None


Probabilities that GCOS criteria is met:

Weighted least square:

None %

Ordinary least square:

None %


Temporal anomaly analyis

The variance of the temporal anomalies provides an additional measure about the stability of the signal AFTER removal of the mean seasonal cylce.

+000 deg


+057/+063 deg