BELMANIP_00115


Location

lon / lat [deg]: -125.6268 / 62.1058

Source network: BELMANIP


Geostationary surface albedo (GSA) data


“+000”


“+057/+063”


Landcover information (based on ESA CCI landcover data)


Landcover fractions @ 2km distance


Landcover fractions @ 20 km distance


Legend


Distance to open water bodies [km]:

1.42

Distance to urban areas [km]:

none in region


Radius: 1 km

Number of landcover classes:

1

Dominant landcover type:

200: bare areas

Fraction of dominant landcover type [%]:

100.0


Radius: 2 km

Number of landcover classes:

1

Dominant landcover type:

200: bare areas

Fraction of dominant landcover type [%]:

100.0


Radius: 5 km

Number of landcover classes:

2

Dominant landcover type:

200: bare areas

Fraction of dominant landcover type [%]:

95.0


Radius: 10 km

Number of landcover classes:

2

Dominant landcover type:

200: bare areas

Fraction of dominant landcover type [%]:

86.0


Radius: 20 km

Number of landcover classes:

6

Dominant landcover type:

200: bare areas

Fraction of dominant landcover type [%]:

59.0


Disturbances


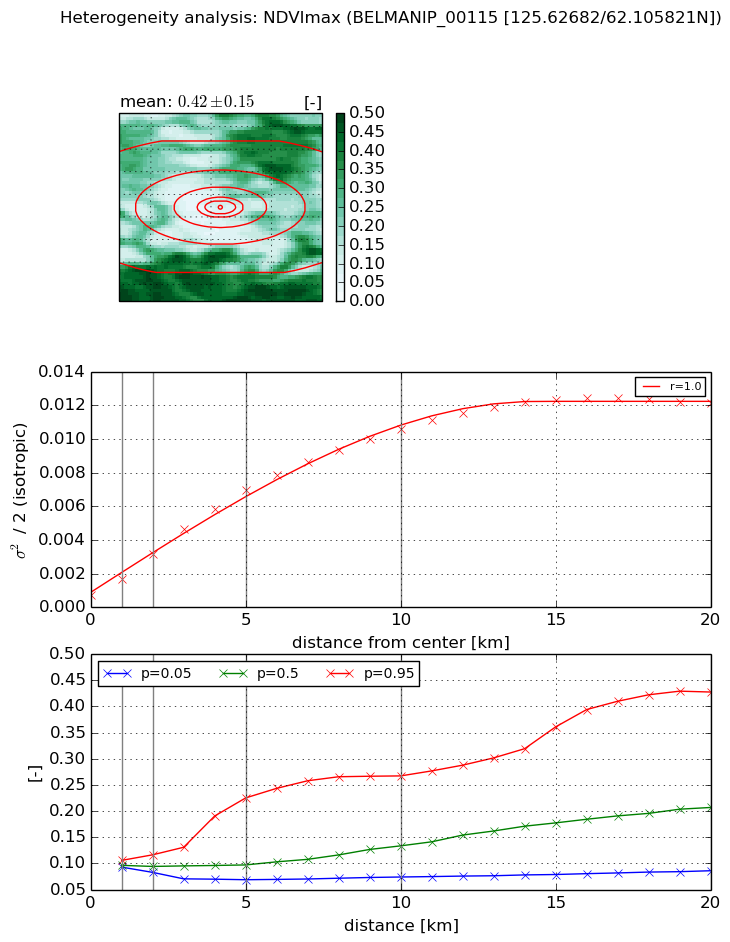
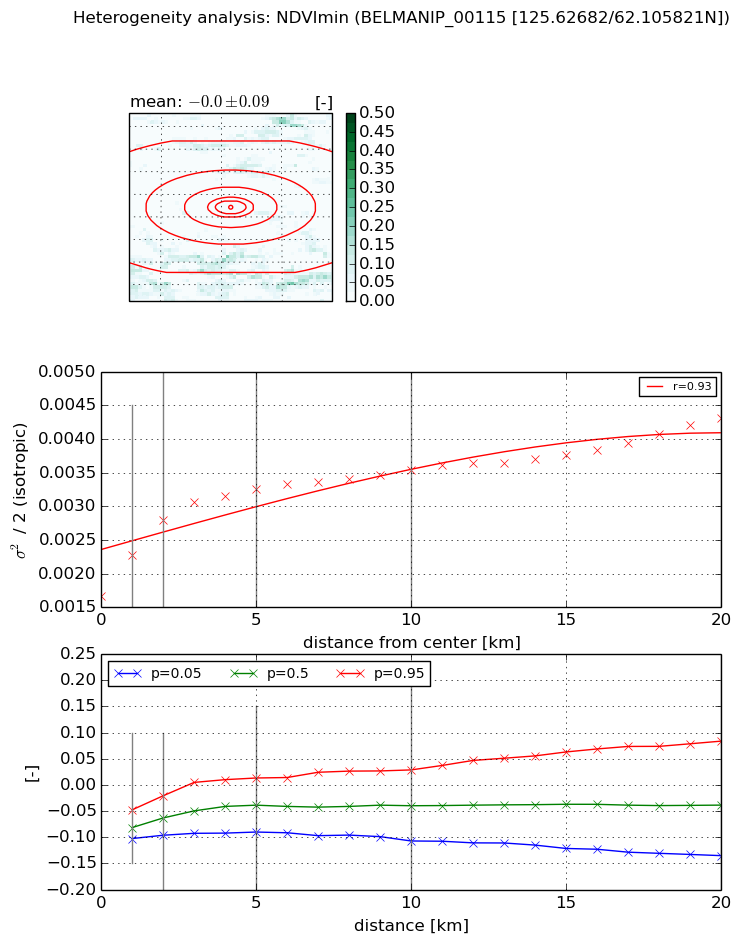
Heterogeneity analysis

The heterogeneity analysis provides information about the spatial and temporal heterogeneity of the site.

Topography


Roman et al. (2009) index


St

2.62658253647

Rcv

0.229271185926

Rse

0.0

Rst

-0.0656491548736

Rsv

0.847248221714


Height range @ 1km [m]

208

Height range @ 2km [m]

315

Height range @ 5km [m]

439

Height range @ 10km [m]

-999

Height range @ 20km [m]

-999


Variance slope @ 1 km

6324

Variance slope @ 2 km

6751

Variance slope @ 5 km

4412

Variance slope @ 10 km

-999

Variance slope @ 20 km

-999


NDVI (max. NDVI composite)


Roman et al. (2009) index


St

2.16902506881

Rcv

0.825787563613

Rse

0.0

Rst

-3.97888873017e-09

Rsv

0.557322311192


NDVI range @ 1km [-]

0.01

NDVI range @ 2km [-]

0.03

NDVI range @ 5km [-]

0.16

NDVI range @ 10km [-]

0.19

NDVI range @ 20km [-]

0.34


Variance slope @ 1 km

0.000953438027158

Variance slope @ 2 km

0.00122964093574

Variance slope @ 5 km

0.00129842753126

Variance slope @ 10 km

0.00101282741245

Variance slope @ 20 km

0.000567971862577


NDVI (min. NDVI composite)I


Roman et al. (2009) index


St

nan

Rcv

nan

Rse

nan

Rst

nan

Rsv

nan


NDVI range @ 1km [-]

0.05

NDVI range @ 2km [-]

0.08

NDVI range @ 5km [-]

0.1

NDVI range @ 10km [-]

0.14

NDVI range @ 20km [-]

0.22


NDVI slope @ 1 km

0.000602281844709

NDVI slope @ 2 km

0.000565126337246

NDVI slope @ 5 km

0.000308767307988

NDVI slope @ 10 km

0.000151410375022

NDVI slope @ 20 km

9.05586314141e-05


Temporal stability analysis

+000 deg (BHR)


BHR statistics

Temporal stability [1/decade]:


abs

rel


Weighted least square:

None


Ordinary least square:

None


Probabilities that GCOS criteria is met:

Weighted least square:

None %

Ordinary least square:

None %


DHR statistics

Temporal stability [1/decade]:


abs

rel


Weighted least square:

None


Ordinary least square:

None


Probabilities that GCOS criteria is met:

Weighted least square:

None %

Ordinary least square:

None %


+057/+063 deg (BHR)


BHR statistics

Temporal stability [1/decade]:


abs

rel


Weighted least square:

None


Ordinary least square:

None


Probabilities that GCOS criteria is met:

Weighted least square:

None %

Ordinary least square:

None %


DHR statistics

Temporal stability [1/decade]:


abs

rel


Weighted least square:

None


Ordinary least square:

None


Probabilities that GCOS criteria is met:

Weighted least square:

None %

Ordinary least square:

None %


Temporal anomaly analyis

The variance of the temporal anomalies provides an additional measure about the stability of the signal AFTER removal of the mean seasonal cylce.

+000 deg


+057/+063 deg