BELMANIP_00120


Location

lon / lat [deg]: 30.4448 / -21.4205

Source network: BELMANIP


Geostationary surface albedo (GSA) data


“+000”


“+057/+063”


Landcover information (based on ESA CCI landcover data)


Landcover fractions @ 2km distance


Landcover fractions @ 20 km distance


Legend


Distance to open water bodies [km]:

13.93

Distance to urban areas [km]:

37.83


Radius: 1 km

Number of landcover classes:

2

Dominant landcover type:

62: Tree cover, broadleaved, decidous (open 15-40%)

Fraction of dominant landcover type [%]:

80.0


Radius: 2 km

Number of landcover classes:

2

Dominant landcover type:

62: Tree cover, broadleaved, decidous (open 15-40%)

Fraction of dominant landcover type [%]:

88.0


Radius: 5 km

Number of landcover classes:

5

Dominant landcover type:

62: Tree cover, broadleaved, decidous (open 15-40%)

Fraction of dominant landcover type [%]:

74.0


Radius: 10 km

Number of landcover classes:

5

Dominant landcover type:

62: Tree cover, broadleaved, decidous (open 15-40%)

Fraction of dominant landcover type [%]:

61.0


Radius: 20 km

Number of landcover classes:

4

Dominant landcover type:

62: Tree cover, broadleaved, decidous (open 15-40%)

Fraction of dominant landcover type [%]:

68.0


Disturbances


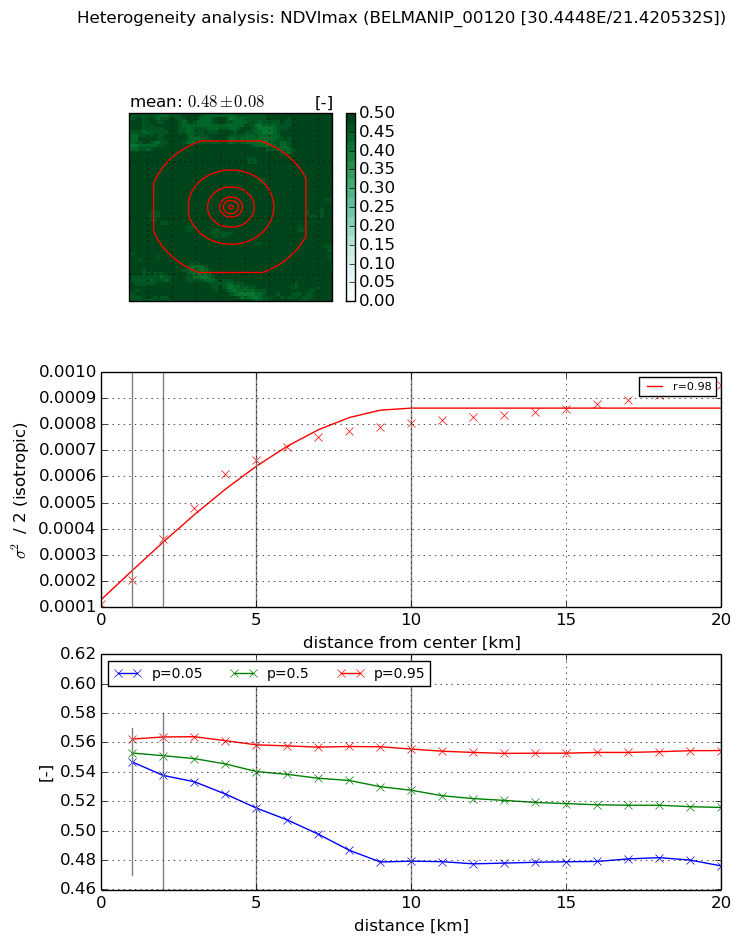
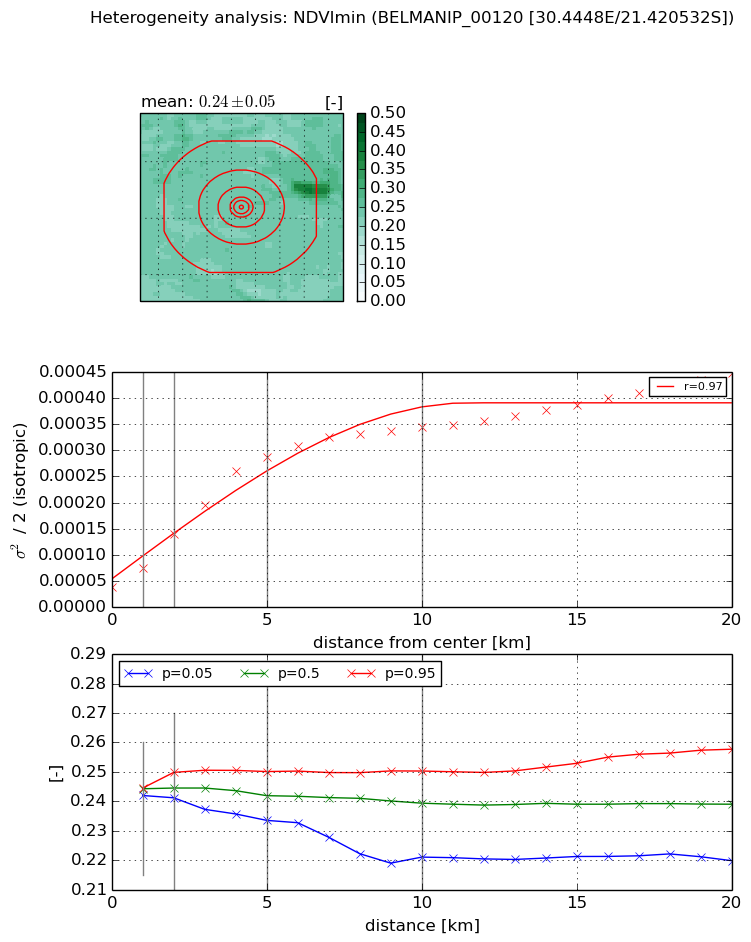
Heterogeneity analysis

The heterogeneity analysis provides information about the spatial and temporal heterogeneity of the site.

Topography


Roman et al. (2009) index


St

17.1767599721

Rcv

0.142168057234

Rse

0.0

Rst

-4.15927095297e-06

Rsv

0.0324823752156


Height range @ 1km [m]

13

Height range @ 2km [m]

27

Height range @ 5km [m]

41

Height range @ 10km [m]

-999

Height range @ 20km [m]

-999


Variance slope @ 1 km

22

Variance slope @ 2 km

27

Variance slope @ 5 km

30

Variance slope @ 10 km

-999

Variance slope @ 20 km

-999


NDVI (max. NDVI composite)


Roman et al. (2009) index


St

2.17182334314

Rcv

0.275765634915

Rse

0.0

Rst

-0.105562565272

Rsv

-0.999999617969


NDVI range @ 1km [-]

0.02

NDVI range @ 2km [-]

0.03

NDVI range @ 5km [-]

0.04

NDVI range @ 10km [-]

0.08

NDVI range @ 20km [-]

0.08


Variance slope @ 1 km

9.10506372125e-05

Variance slope @ 2 km

0.000122917157983

Variance slope @ 5 km

0.000116928737806

Variance slope @ 10 km

7.00055882478e-05

Variance slope @ 20 km

3.34444804083e-05


NDVI (min. NDVI composite)I


Roman et al. (2009) index


St

2.33143816557

Rcv

0.278422194238

Rse

0.0

Rst

-0.207421664464

Rsv

0.800915551993


NDVI range @ 1km [-]

0.0

NDVI range @ 2km [-]

0.01

NDVI range @ 5km [-]

0.02

NDVI range @ 10km [-]

0.03

NDVI range @ 20km [-]

0.04


NDVI slope @ 1 km

3.65428480536e-05

NDVI slope @ 2 km

5.01174524035e-05

NDVI slope @ 5 km

5.27974852531e-05

NDVI slope @ 10 km

3.14025991157e-05

NDVI slope @ 20 km

1.66903520348e-05


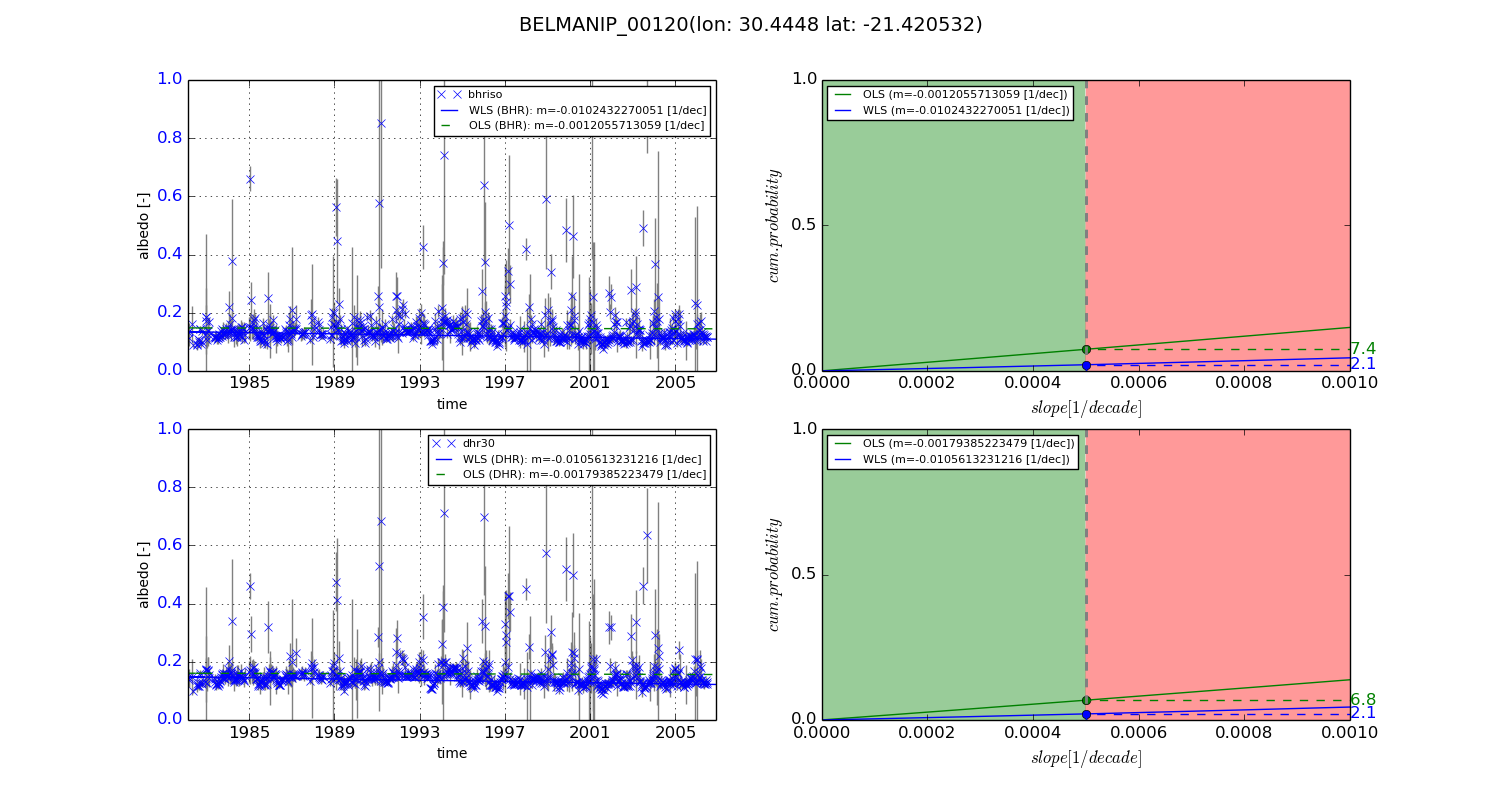
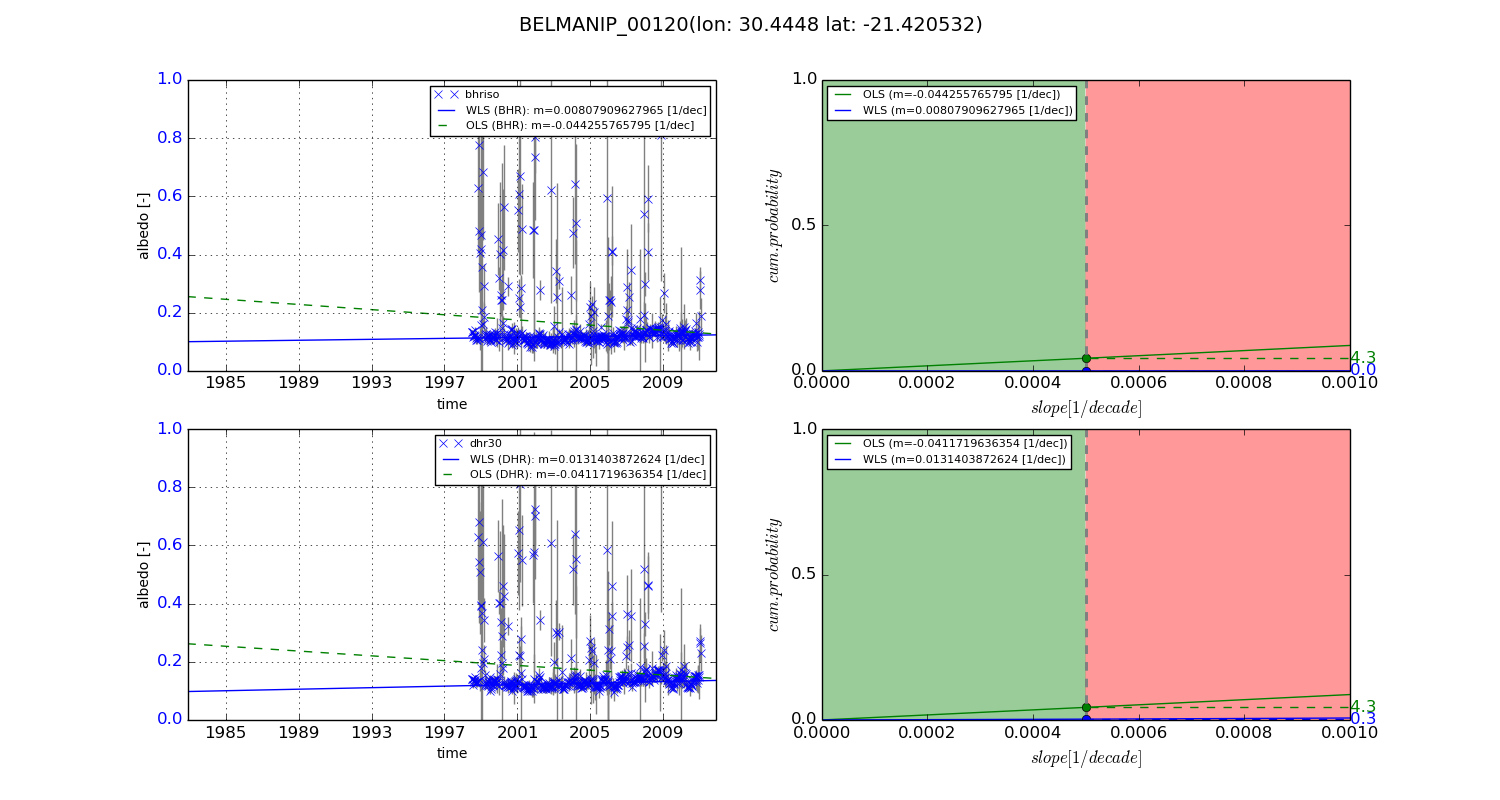
Temporal stability analysis

+000 deg (BHR)


BHR statistics

Temporal stability [1/decade]:


abs

rel


Weighted least square:

-0.0102432270051


Ordinary least square:

-0.0012055713059


Probabilities that GCOS criteria is met:

Weighted least square:

2.1 %

Ordinary least square:

7.4 %


DHR statistics

Temporal stability [1/decade]:


abs

rel


Weighted least square:

-0.0105613231216


Ordinary least square:

-0.00179385223479


Probabilities that GCOS criteria is met:

Weighted least square:

2.1 %

Ordinary least square:

6.8 %


+057/+063 deg (BHR)


BHR statistics

Temporal stability [1/decade]:


abs

rel


Weighted least square:

0.00807909627965


Ordinary least square:

-0.044255765795


Probabilities that GCOS criteria is met:

Weighted least square:

0.0 %

Ordinary least square:

4.3 %


DHR statistics

Temporal stability [1/decade]:


abs

rel


Weighted least square:

0.0131403872624


Ordinary least square:

-0.0411719636354


Probabilities that GCOS criteria is met:

Weighted least square:

0.3 %

Ordinary least square:

4.3 %


Temporal anomaly analyis

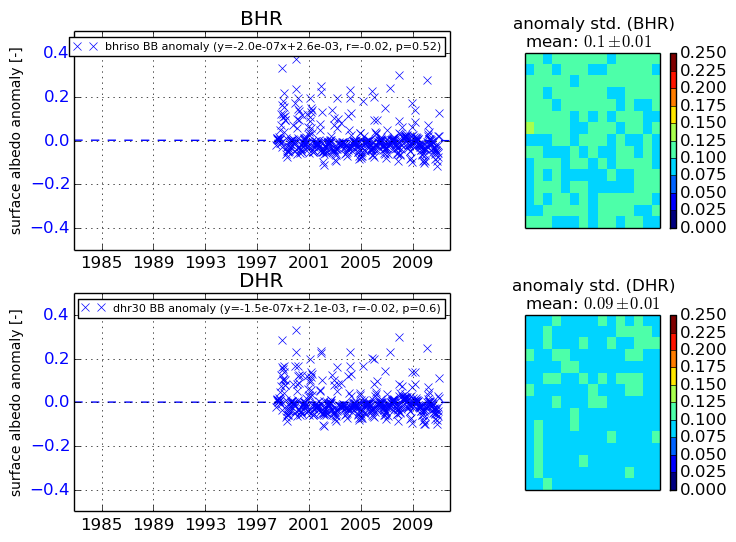
The variance of the temporal anomalies provides an additional measure about the stability of the signal AFTER removal of the mean seasonal cylce.
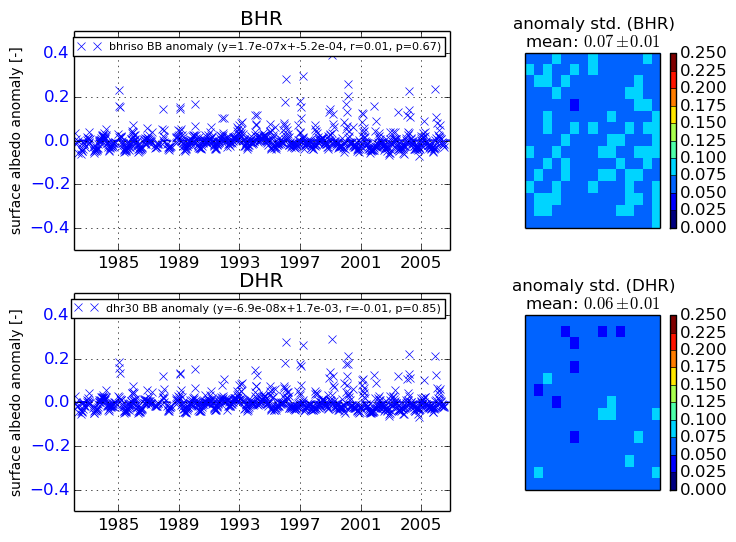
+000 deg


+057/+063 deg