BELMANIP_00123


Location

lon / lat [deg]: 23.828 / -27.7076

Source network: BELMANIP


Geostationary surface albedo (GSA) data


“+000”


“+057/+063”


Landcover information (based on ESA CCI landcover data)


Landcover fractions @ 2km distance


Landcover fractions @ 20 km distance


Legend


Distance to open water bodies [km]:

52.19

Distance to urban areas [km]:

37.77


Radius: 1 km

Number of landcover classes:

2

Dominant landcover type:

130: grassland

Fraction of dominant landcover type [%]:

57.0


Radius: 2 km

Number of landcover classes:

2

Dominant landcover type:

120: Shrubland

Fraction of dominant landcover type [%]:

56.0


Radius: 5 km

Number of landcover classes:

2

Dominant landcover type:

120: Shrubland

Fraction of dominant landcover type [%]:

62.0


Radius: 10 km

Number of landcover classes:

2

Dominant landcover type:

120: Shrubland

Fraction of dominant landcover type [%]:

75.0


Radius: 20 km

Number of landcover classes:

2

Dominant landcover type:

120: Shrubland

Fraction of dominant landcover type [%]:

88.0


Disturbances


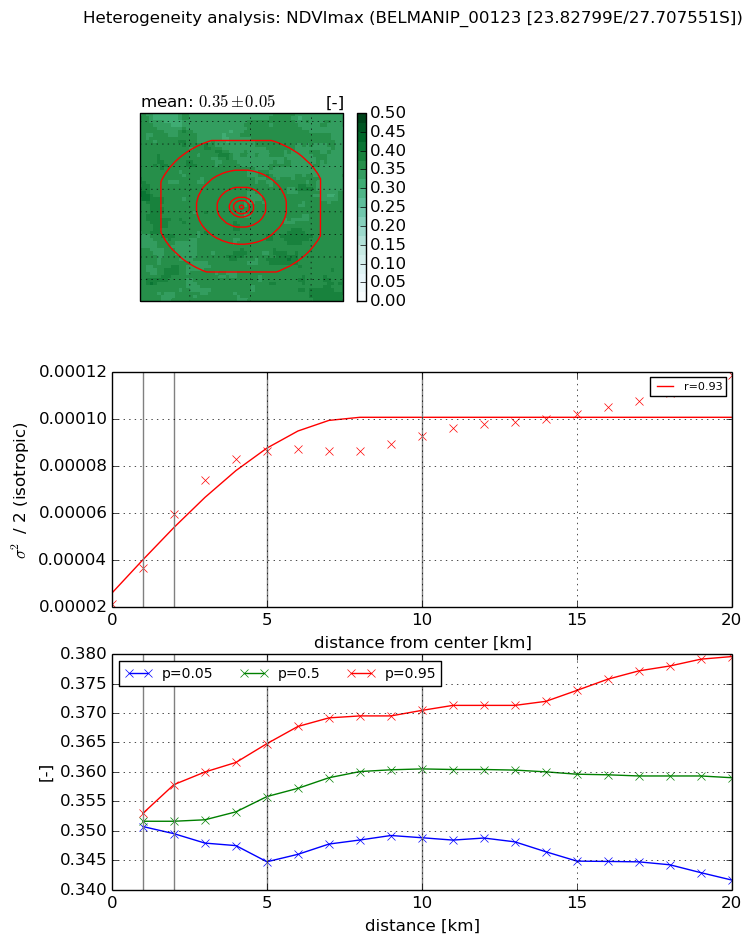
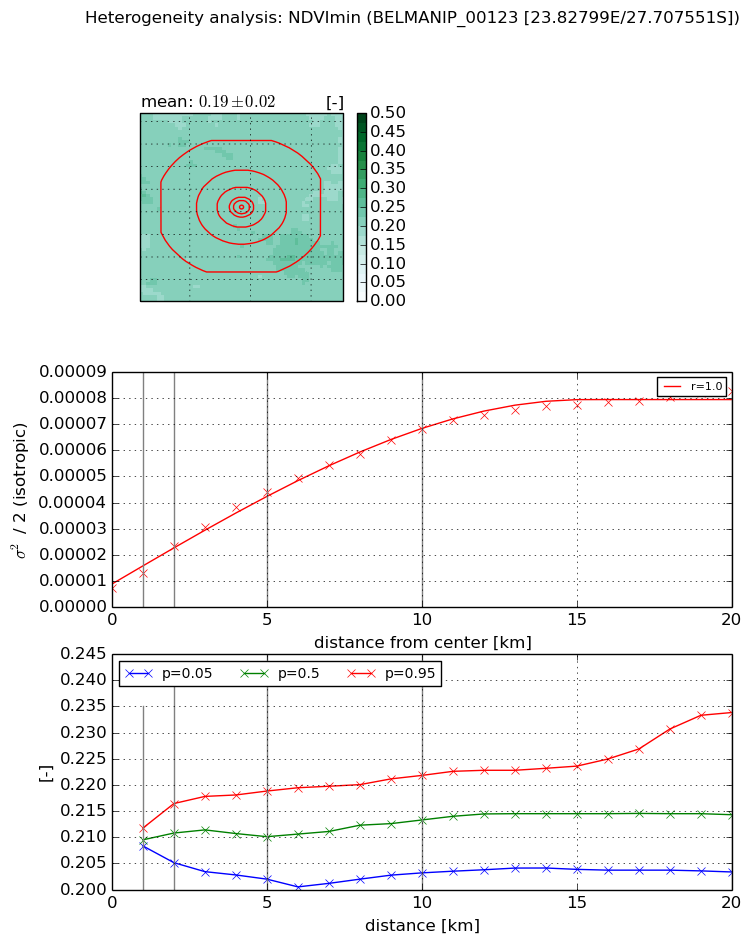
Heterogeneity analysis

The heterogeneity analysis provides information about the spatial and temporal heterogeneity of the site.

Topography


Roman et al. (2009) index


St

1.45859316545

Rcv

0.342340863591

Rse

0.0

Rst

2.06452227119e-05

Rsv

1.71441489125


Height range @ 1km [m]

7

Height range @ 2km [m]

13

Height range @ 5km [m]

24

Height range @ 10km [m]

-999

Height range @ 20km [m]

-999


Variance slope @ 1 km

4

Variance slope @ 2 km

6

Variance slope @ 5 km

13

Variance slope @ 10 km

-999

Variance slope @ 20 km

-999


NDVI (max. NDVI composite)


Roman et al. (2009) index


St

nan

Rcv

nan

Rse

nan

Rst

nan

Rsv

nan


NDVI range @ 1km [-]

0.0

NDVI range @ 2km [-]

0.01

NDVI range @ 5km [-]

0.02

NDVI range @ 10km [-]

0.02

NDVI range @ 20km [-]

0.04


Variance slope @ 1 km

1.50525427636e-05

Variance slope @ 2 km

1.91913398424e-05

Variance slope @ 5 km

1.36877690456e-05

Variance slope @ 10 km

6.16192299461e-06

Variance slope @ 20 km

3.44352808956e-06


NDVI (min. NDVI composite)I


Roman et al. (2009) index


St

2.3592140744

Rcv

0.20550698304

Rse

0.0

Rst

-0.0661032639287

Rsv

-0.999999664378


NDVI range @ 1km [-]

0.0

NDVI range @ 2km [-]

0.01

NDVI range @ 5km [-]

0.02

NDVI range @ 10km [-]

0.02

NDVI range @ 20km [-]

0.03


NDVI slope @ 1 km

5.81335462031e-06

NDVI slope @ 2 km

7.94532269462e-06

NDVI slope @ 5 km

7.59363802752e-06

NDVI slope @ 10 km

6.11493753587e-06

NDVI slope @ 20 km

3.61342478951e-06


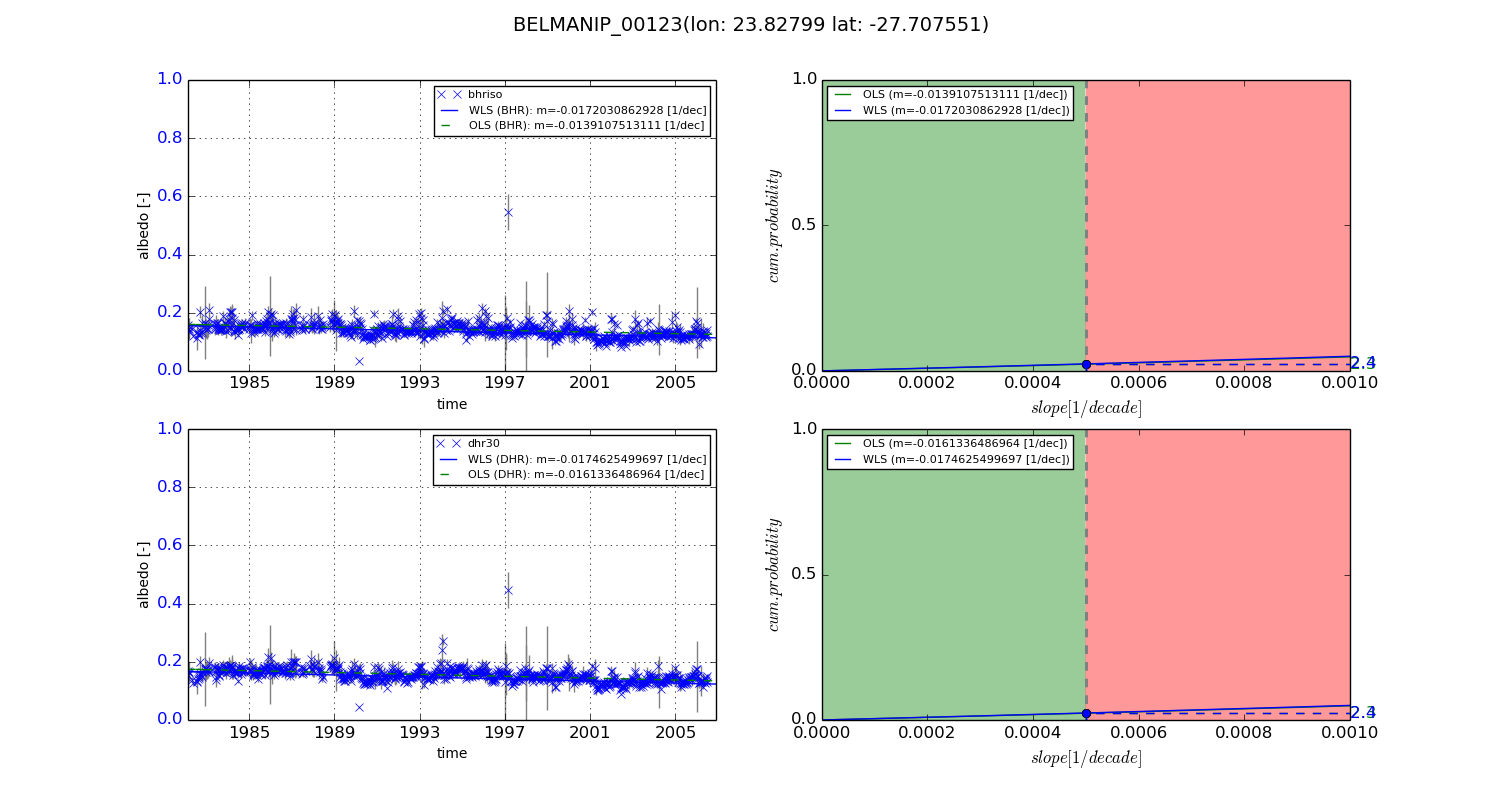
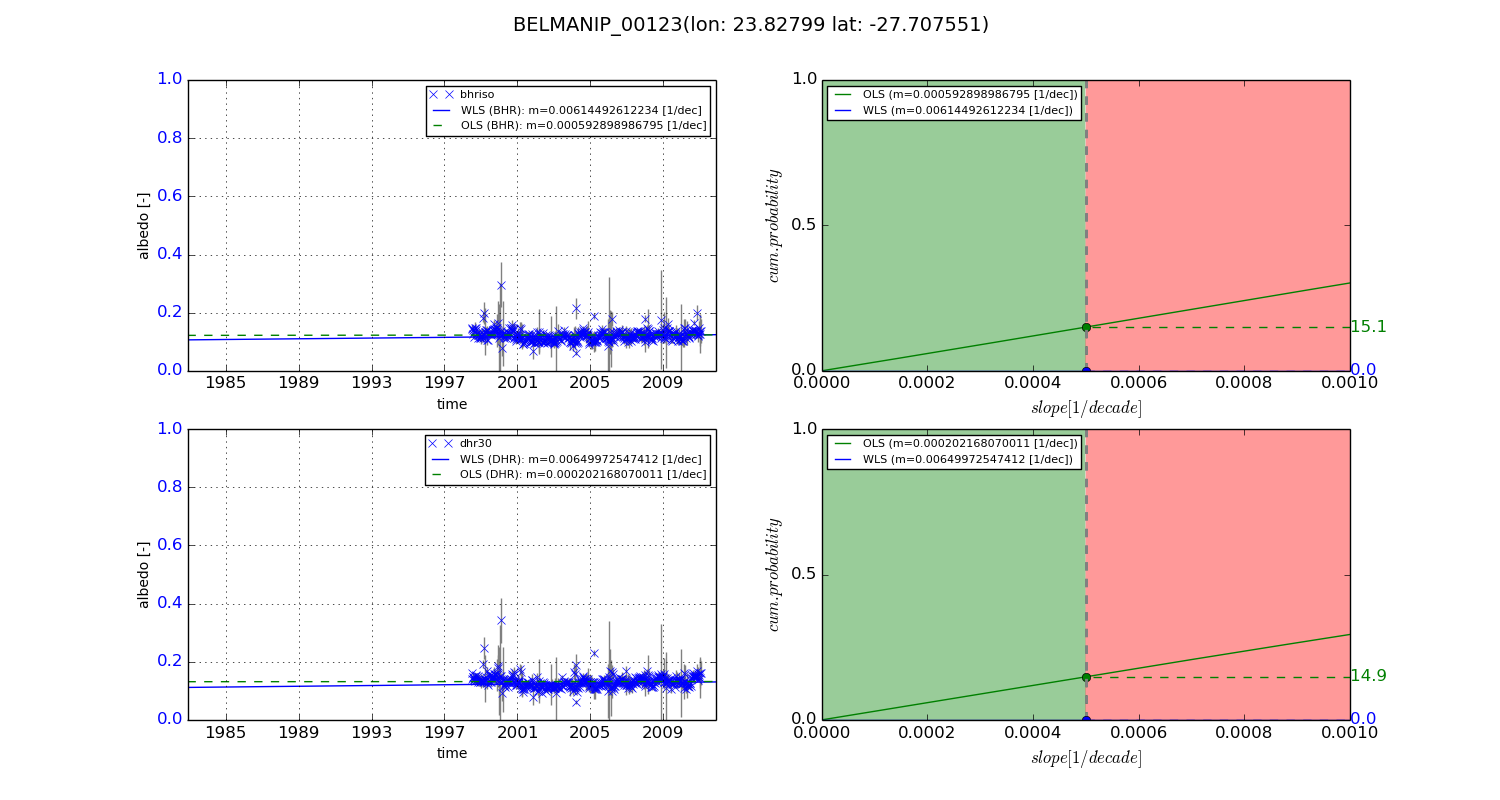
Temporal stability analysis

+000 deg (BHR)


BHR statistics

Temporal stability [1/decade]:


abs

rel


Weighted least square:

-0.0172030862928


Ordinary least square:

-0.0139107513111


Probabilities that GCOS criteria is met:

Weighted least square:

2.4 %

Ordinary least square:

2.3 %


DHR statistics

Temporal stability [1/decade]:


abs

rel


Weighted least square:

-0.0174625499697


Ordinary least square:

-0.0161336486964


Probabilities that GCOS criteria is met:

Weighted least square:

2.4 %

Ordinary least square:

2.3 %


+057/+063 deg (BHR)


BHR statistics

Temporal stability [1/decade]:


abs

rel


Weighted least square:

0.00614492612234


Ordinary least square:

0.000592898986795


Probabilities that GCOS criteria is met:

Weighted least square:

0.0 %

Ordinary least square:

15.1 %


DHR statistics

Temporal stability [1/decade]:


abs

rel


Weighted least square:

0.00649972547412


Ordinary least square:

0.000202168070011


Probabilities that GCOS criteria is met:

Weighted least square:

0.0 %

Ordinary least square:

14.9 %


Temporal anomaly analyis

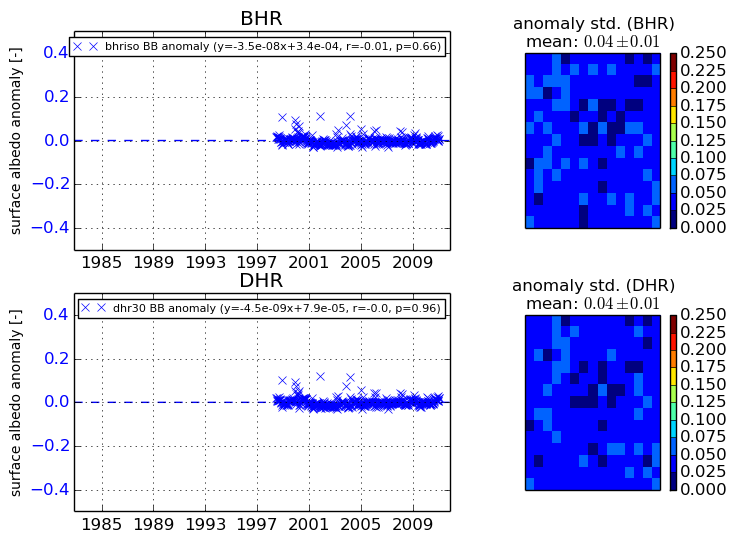
The variance of the temporal anomalies provides an additional measure about the stability of the signal AFTER removal of the mean seasonal cylce.
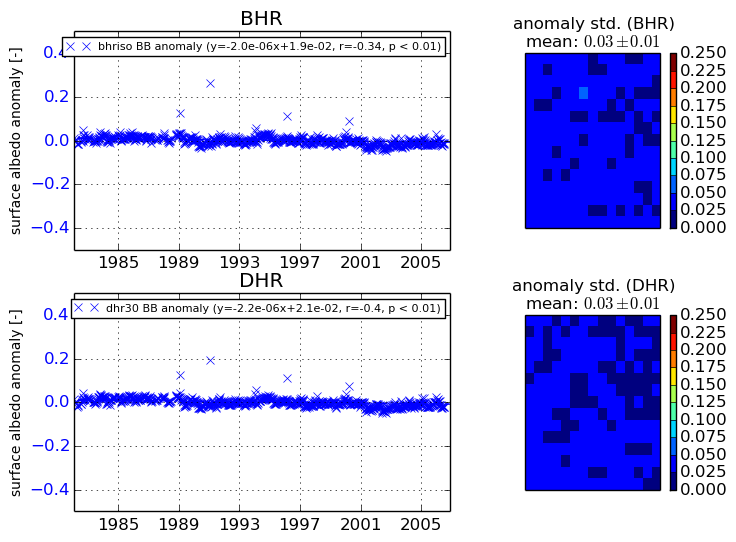
+000 deg


+057/+063 deg