BELMANIP_00124


Location

lon / lat [deg]: 20.2106 / -23.9527

Source network: BELMANIP


Geostationary surface albedo (GSA) data


“+000”


“+057/+063”


Landcover information (based on ESA CCI landcover data)


Landcover fractions @ 2km distance


Landcover fractions @ 20 km distance


Legend


Distance to open water bodies [km]:

50.73

Distance to urban areas [km]:

none in region


Radius: 1 km

Number of landcover classes:

1

Dominant landcover type:

130: grassland

Fraction of dominant landcover type [%]:

100.0


Radius: 2 km

Number of landcover classes:

1

Dominant landcover type:

130: grassland

Fraction of dominant landcover type [%]:

100.0


Radius: 5 km

Number of landcover classes:

1

Dominant landcover type:

130: grassland

Fraction of dominant landcover type [%]:

100.0


Radius: 10 km

Number of landcover classes:

1

Dominant landcover type:

130: grassland

Fraction of dominant landcover type [%]:

100.0


Radius: 20 km

Number of landcover classes:

1

Dominant landcover type:

130: grassland

Fraction of dominant landcover type [%]:

100.0


Disturbances


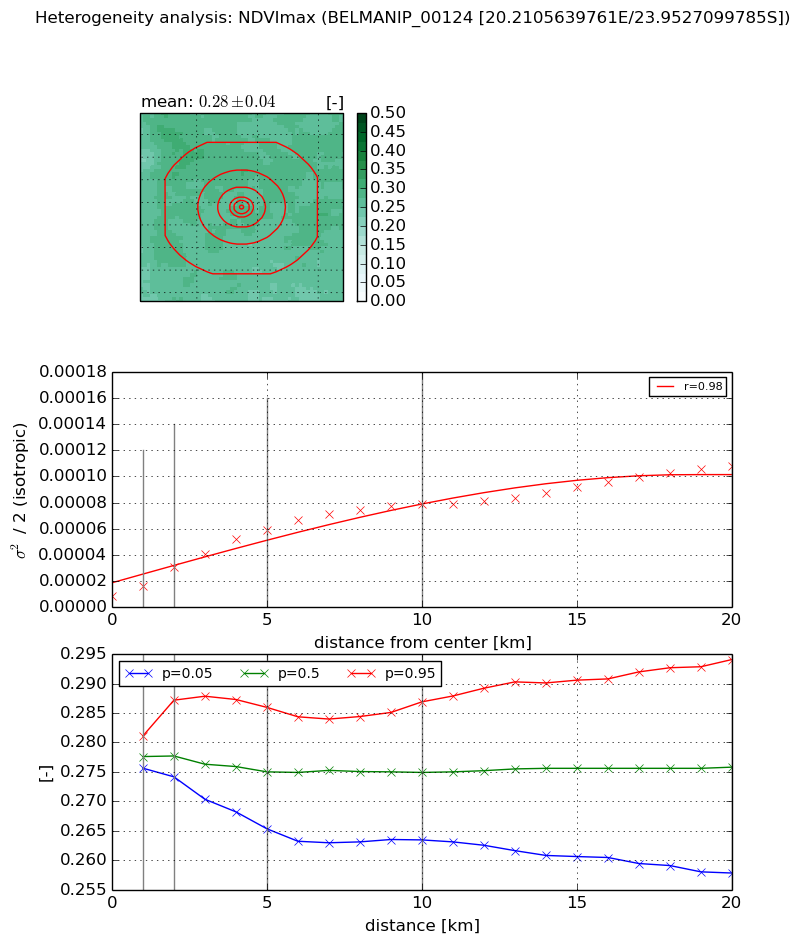
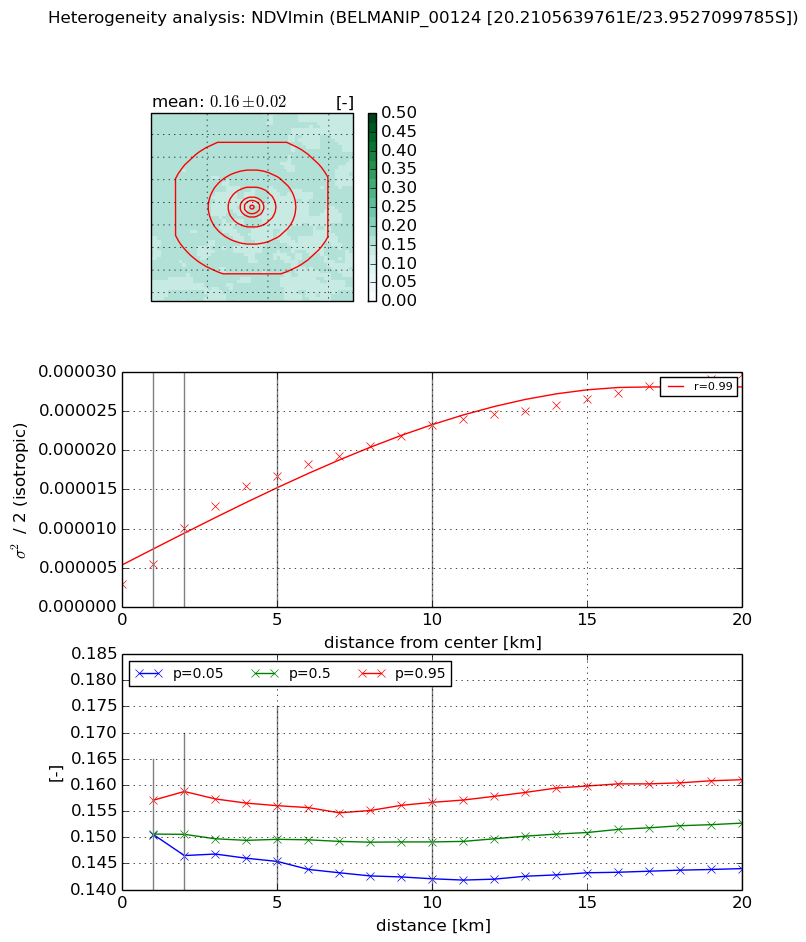
Heterogeneity analysis

The heterogeneity analysis provides information about the spatial and temporal heterogeneity of the site.

Topography


Roman et al. (2009) index


St

2.89360648068

Rcv

0.0592682252999

Rse

0.0

Rst

-0.160546974399

Rsv

0.816953282827


Height range @ 1km [m]

18

Height range @ 2km [m]

19

Height range @ 5km [m]

17

Height range @ 10km [m]

-999

Height range @ 20km [m]

-999


Variance slope @ 1 km

14

Variance slope @ 2 km

11

Variance slope @ 5 km

5

Variance slope @ 10 km

-999

Variance slope @ 20 km

-999


NDVI (max. NDVI composite)


Roman et al. (2009) index


St

15.4325436131

Rcv

0.132151399915

Rse

0.0

Rst

0.0496759726204

Rsv

0.0125670238258


NDVI range @ 1km [-]

0.01

NDVI range @ 2km [-]

0.01

NDVI range @ 5km [-]

0.02

NDVI range @ 10km [-]

0.02

NDVI range @ 20km [-]

0.04


Variance slope @ 1 km

7.47244689966e-06

Variance slope @ 2 km

1.07934041012e-05

Variance slope @ 5 km

1.06209309501e-05

Variance slope @ 10 km

7.27470102566e-06

Variance slope @ 20 km

4.34689582039e-06


NDVI (min. NDVI composite)I


Roman et al. (2009) index


St

11.9468737382

Rcv

-0.12383961641

Rse

0.0

Rst

-0.0782099495372

Rsv

0.0490621529622


NDVI range @ 1km [-]

0.01

NDVI range @ 2km [-]

0.01

NDVI range @ 5km [-]

0.01

NDVI range @ 10km [-]

0.01

NDVI range @ 20km [-]

0.02


NDVI slope @ 1 km

2.55988450325e-06

NDVI slope @ 2 km

3.54652522269e-06

NDVI slope @ 5 km

2.90531713834e-06

NDVI slope @ 10 km

1.94066848764e-06

NDVI slope @ 20 km

1.18645220986e-06


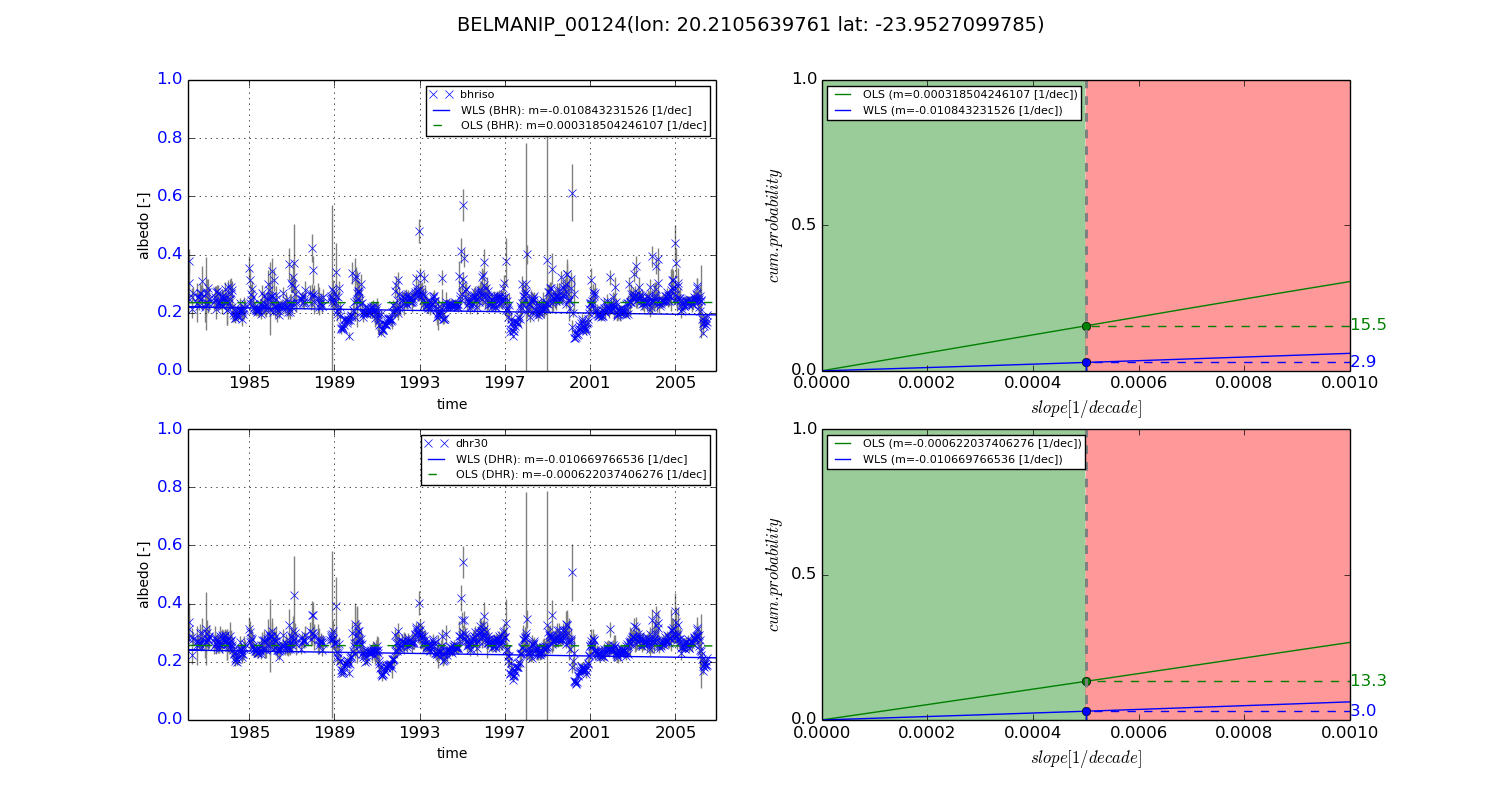
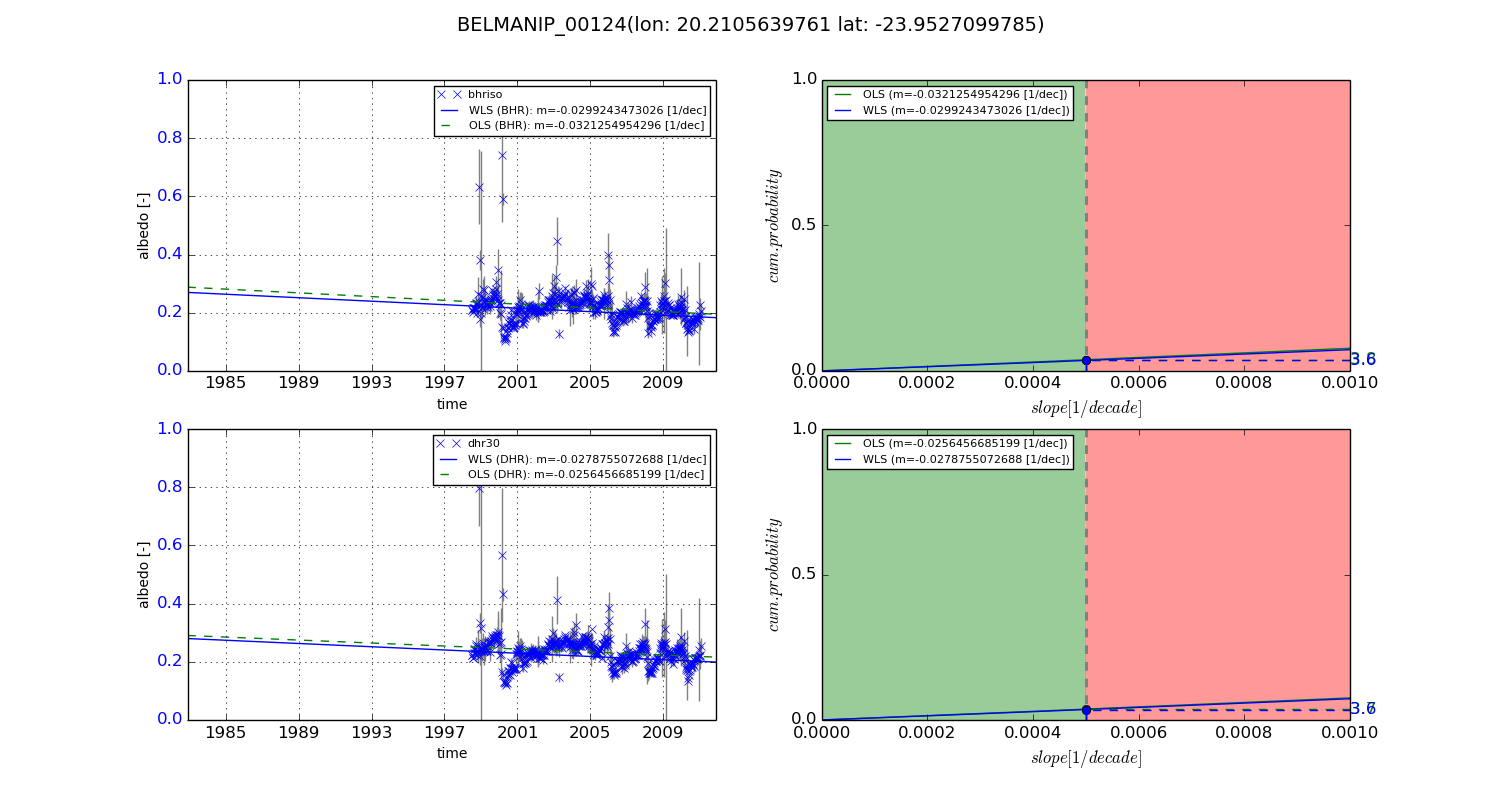
Temporal stability analysis

+000 deg (BHR)


BHR statistics

Temporal stability [1/decade]:


abs

rel


Weighted least square:

-0.010843231526


Ordinary least square:

0.000318504246107


Probabilities that GCOS criteria is met:

Weighted least square:

2.9 %

Ordinary least square:

15.5 %


DHR statistics

Temporal stability [1/decade]:


abs

rel


Weighted least square:

-0.010669766536


Ordinary least square:

-0.000622037406276


Probabilities that GCOS criteria is met:

Weighted least square:

3.0 %

Ordinary least square:

13.3 %


+057/+063 deg (BHR)


BHR statistics

Temporal stability [1/decade]:


abs

rel


Weighted least square:

-0.0299243473026


Ordinary least square:

-0.0321254954296


Probabilities that GCOS criteria is met:

Weighted least square:

3.6 %

Ordinary least square:

3.8 %


DHR statistics

Temporal stability [1/decade]:


abs

rel


Weighted least square:

-0.0278755072688


Ordinary least square:

-0.0256456685199


Probabilities that GCOS criteria is met:

Weighted least square:

3.6 %

Ordinary least square:

3.7 %


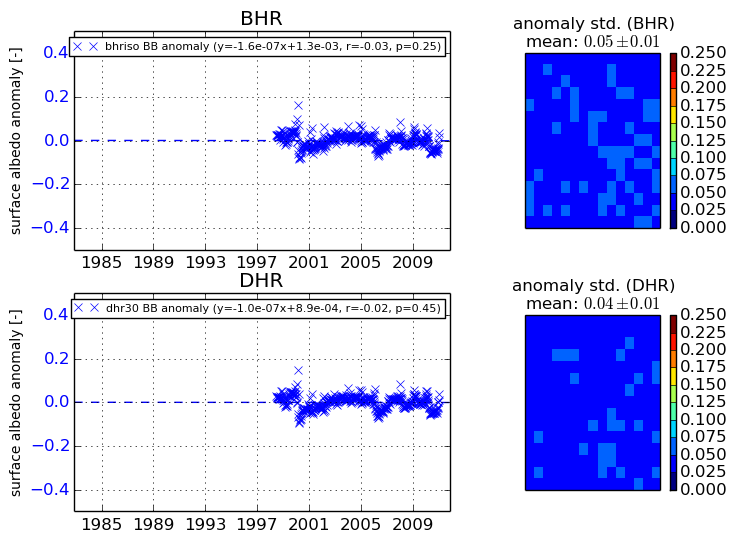
Temporal anomaly analyis

The variance of the temporal anomalies provides an additional measure about the stability of the signal AFTER removal of the mean seasonal cylce.
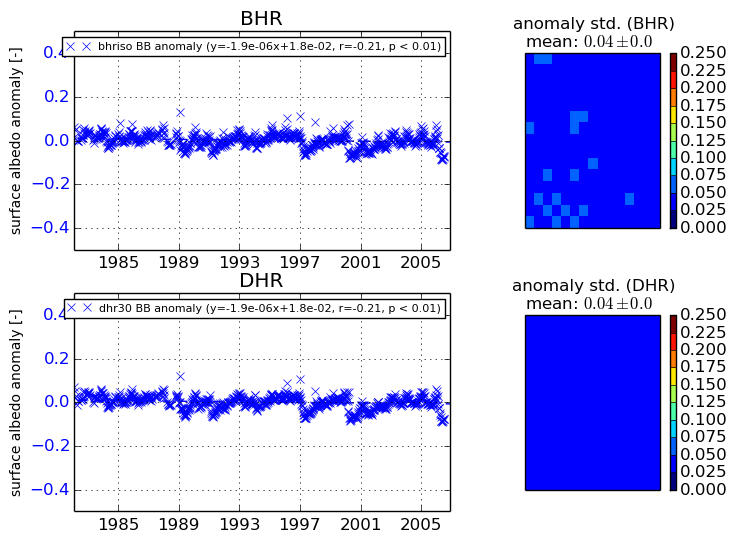
+000 deg


+057/+063 deg