BELMANIP_00126


Location

lon / lat [deg]: 19.646 / -29.4015

Source network: BELMANIP


Geostationary surface albedo (GSA) data


“+000”


“+057/+063”


Landcover information (based on ESA CCI landcover data)


Landcover fractions @ 2km distance


Landcover fractions @ 20 km distance


Legend


Distance to open water bodies [km]:

33.1

Distance to urban areas [km]:

none in region


Radius: 1 km

Number of landcover classes:

1

Dominant landcover type:

150: Sparse vegetation (tree, shrub, herbaceous cover) (<15%)

Fraction of dominant landcover type [%]:

100.0


Radius: 2 km

Number of landcover classes:

2

Dominant landcover type:

150: Sparse vegetation (tree, shrub, herbaceous cover) (<15%)

Fraction of dominant landcover type [%]:

83.0


Radius: 5 km

Number of landcover classes:

2

Dominant landcover type:

150: Sparse vegetation (tree, shrub, herbaceous cover) (<15%)

Fraction of dominant landcover type [%]:

92.0


Radius: 10 km

Number of landcover classes:

3

Dominant landcover type:

150: Sparse vegetation (tree, shrub, herbaceous cover) (<15%)

Fraction of dominant landcover type [%]:

90.0


Radius: 20 km

Number of landcover classes:

3

Dominant landcover type:

150: Sparse vegetation (tree, shrub, herbaceous cover) (<15%)

Fraction of dominant landcover type [%]:

86.0


Disturbances


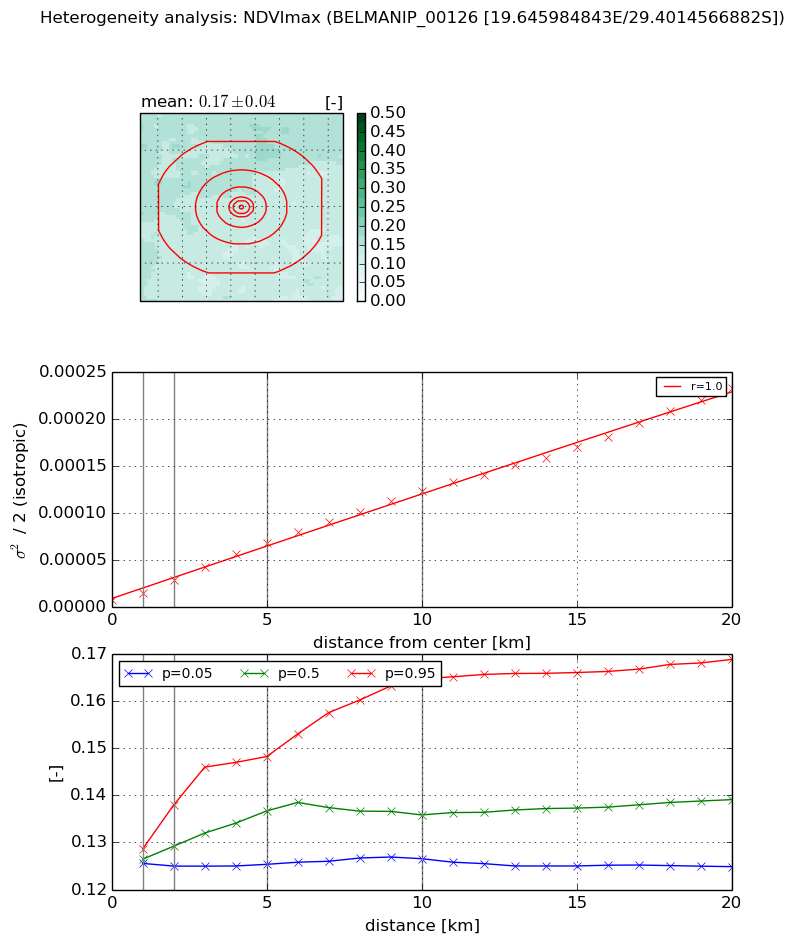
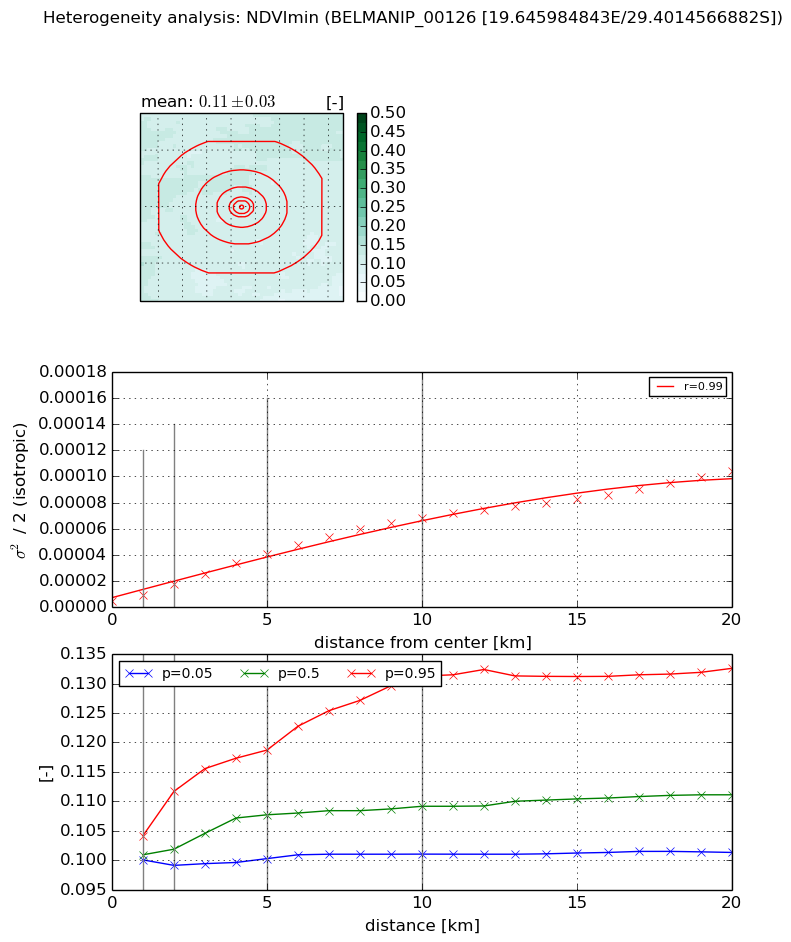
Heterogeneity analysis

The heterogeneity analysis provides information about the spatial and temporal heterogeneity of the site.

Topography


Roman et al. (2009) index


St

0.00602673953593

Rcv

0.737283649064

Rse

0.0

Rst

2.83508579993e-05

Rsv

497.044279873


Height range @ 1km [m]

7

Height range @ 2km [m]

12

Height range @ 5km [m]

32

Height range @ 10km [m]

-999

Height range @ 20km [m]

-999


Variance slope @ 1 km

8

Variance slope @ 2 km

12

Variance slope @ 5 km

22

Variance slope @ 10 km

-999

Variance slope @ 20 km

-999


NDVI (max. NDVI composite)


Roman et al. (2009) index


St

3.93255139691

Rcv

0.0998675312971

Rse

0.0

Rst

-0.082746996402

Rsv

-0.58024899199


NDVI range @ 1km [-]

0.0

NDVI range @ 2km [-]

0.01

NDVI range @ 5km [-]

0.02

NDVI range @ 10km [-]

0.04

NDVI range @ 20km [-]

0.04


Variance slope @ 1 km

7.13514573597e-06

Variance slope @ 2 km

1.04651861553e-05

Variance slope @ 5 km

1.24621157132e-05

Variance slope @ 10 km

1.18199767401e-05

Variance slope @ 20 km

1.09889571934e-05


NDVI (min. NDVI composite)I


Roman et al. (2009) index


St

2.52061383478

Rcv

0.147509808398

Rse

0.0

Rst

-0.0426764802797

Rsv

-0.999999989999


NDVI range @ 1km [-]

0.0

NDVI range @ 2km [-]

0.01

NDVI range @ 5km [-]

0.02

NDVI range @ 10km [-]

0.03

NDVI range @ 20km [-]

0.03


NDVI slope @ 1 km

4.35646867563e-06

NDVI slope @ 2 km

6.30635877072e-06

NDVI slope @ 5 km

7.43729606691e-06

NDVI slope @ 10 km

6.67761524534e-06

NDVI slope @ 20 km

4.70407641453e-06


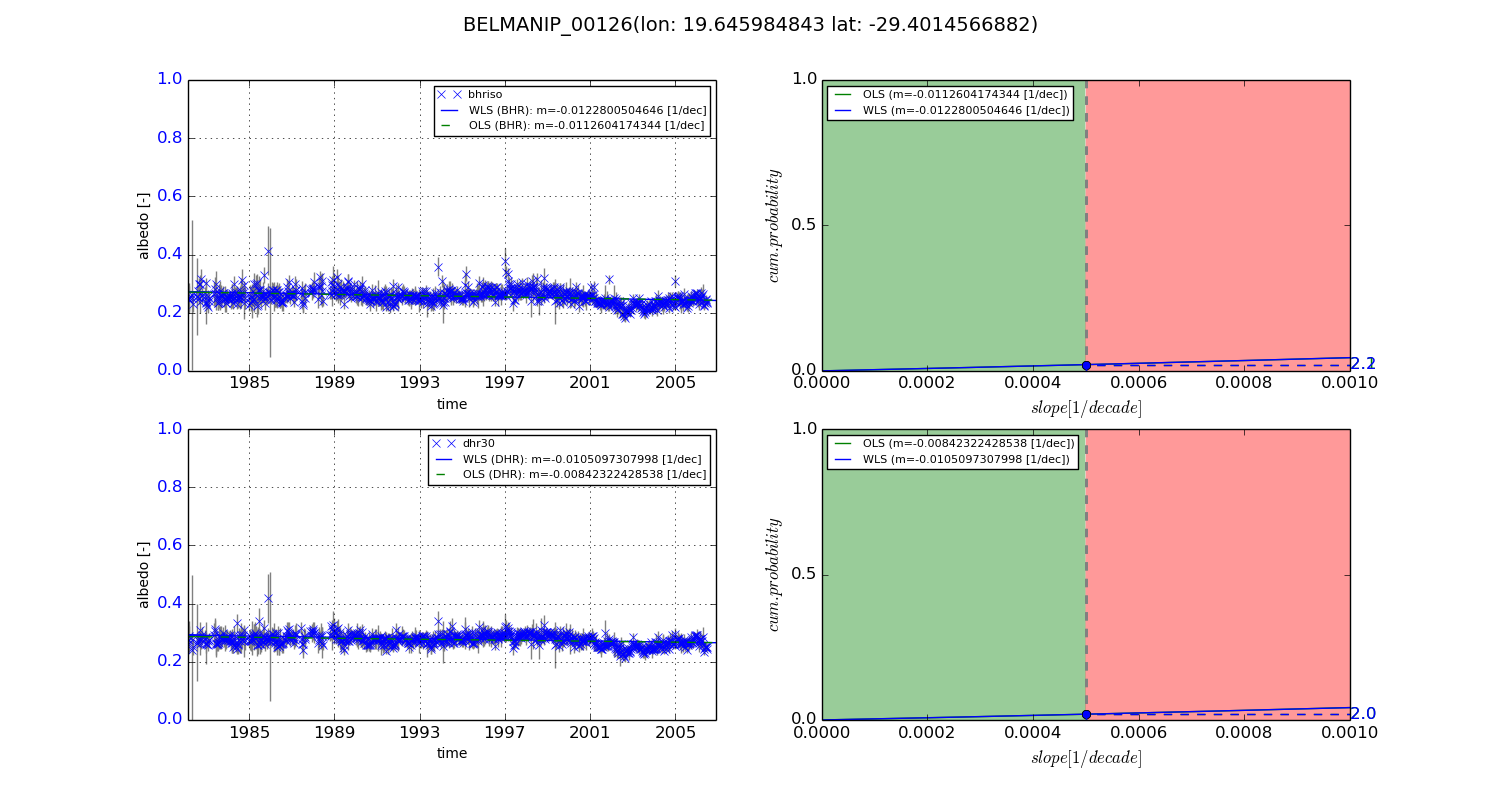
Temporal stability analysis

+000 deg (BHR)


BHR statistics

Temporal stability [1/decade]:


abs

rel


Weighted least square:

-0.0122800504646


Ordinary least square:

-0.0112604174344


Probabilities that GCOS criteria is met:

Weighted least square:

2.2 %

Ordinary least square:

2.1 %


DHR statistics

Temporal stability [1/decade]:


abs

rel


Weighted least square:

-0.0105097307998


Ordinary least square:

-0.00842322428538


Probabilities that GCOS criteria is met:

Weighted least square:

2.0 %

Ordinary least square:

2.0 %


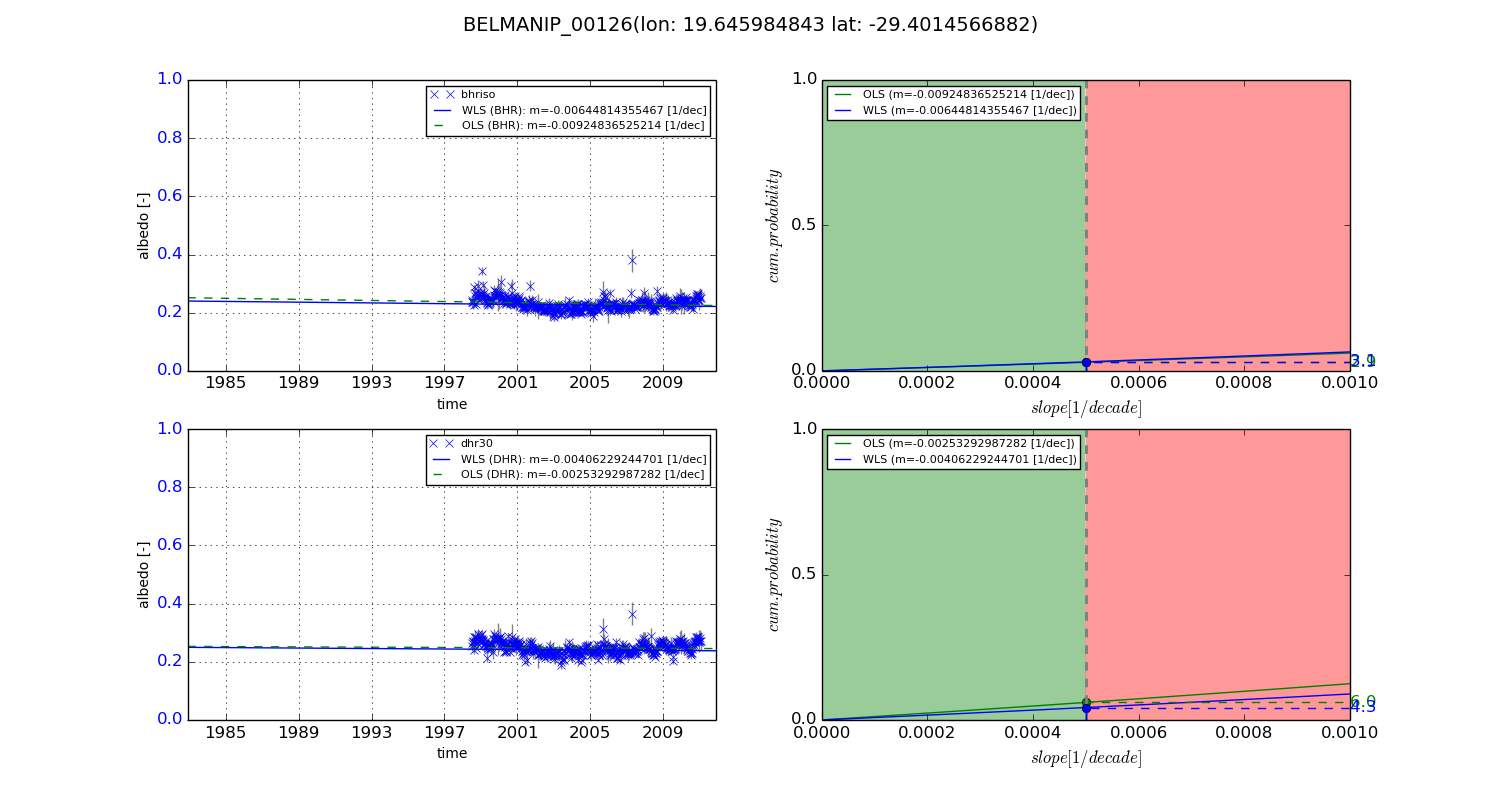
+057/+063 deg (BHR)


BHR statistics

Temporal stability [1/decade]:


abs

rel


Weighted least square:

-0.00644814355467


Ordinary least square:

-0.00924836525214


Probabilities that GCOS criteria is met:

Weighted least square:

3.1 %

Ordinary least square:

2.9 %


DHR statistics

Temporal stability [1/decade]:


abs

rel


Weighted least square:

-0.00406229244701


Ordinary least square:

-0.00253292987282


Probabilities that GCOS criteria is met:

Weighted least square:

4.3 %

Ordinary least square:

6.0 %


Temporal anomaly analyis

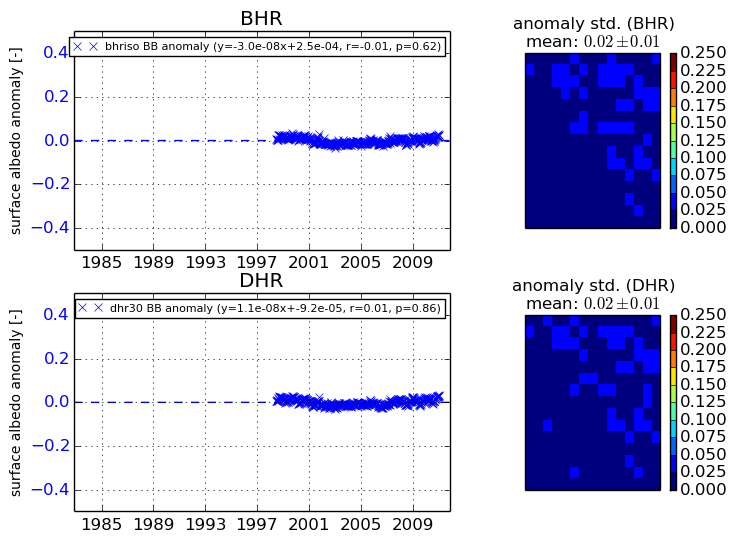
The variance of the temporal anomalies provides an additional measure about the stability of the signal AFTER removal of the mean seasonal cylce.
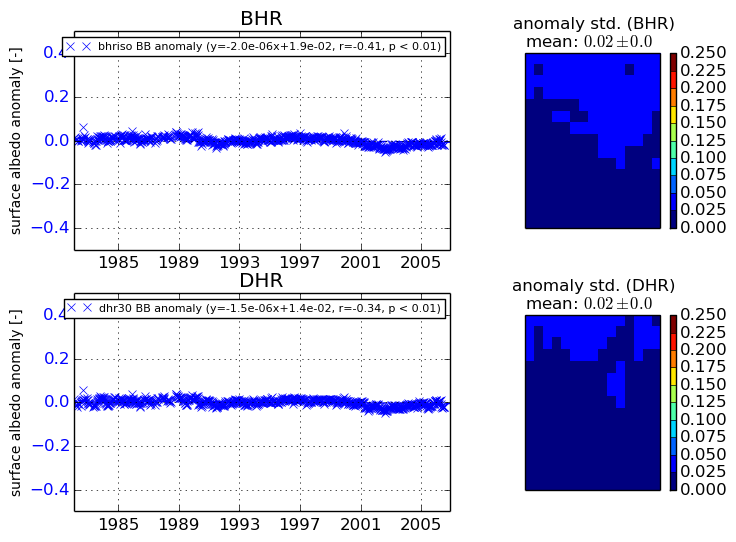
+000 deg


+057/+063 deg