BELMANIP_00128


Location

lon / lat [deg]: 28.1953 / -23.4833

Source network: BELMANIP


Geostationary surface albedo (GSA) data


“+000”


“+057/+063”


Landcover information (based on ESA CCI landcover data)


Landcover fractions @ 2km distance


Landcover fractions @ 20 km distance


Legend


Distance to open water bodies [km]:

49.24

Distance to urban areas [km]:

4.6


Radius: 1 km

Number of landcover classes:

2

Dominant landcover type:

10: cropland, rainfed

Fraction of dominant landcover type [%]:

97.0


Radius: 2 km

Number of landcover classes:

5

Dominant landcover type:

10: cropland, rainfed

Fraction of dominant landcover type [%]:

51.0


Radius: 5 km

Number of landcover classes:

4

Dominant landcover type:

120: Shrubland

Fraction of dominant landcover type [%]:

66.0


Radius: 10 km

Number of landcover classes:

6

Dominant landcover type:

120: Shrubland

Fraction of dominant landcover type [%]:

46.0


Radius: 20 km

Number of landcover classes:

7

Dominant landcover type:

120: Shrubland

Fraction of dominant landcover type [%]:

33.0


Disturbances


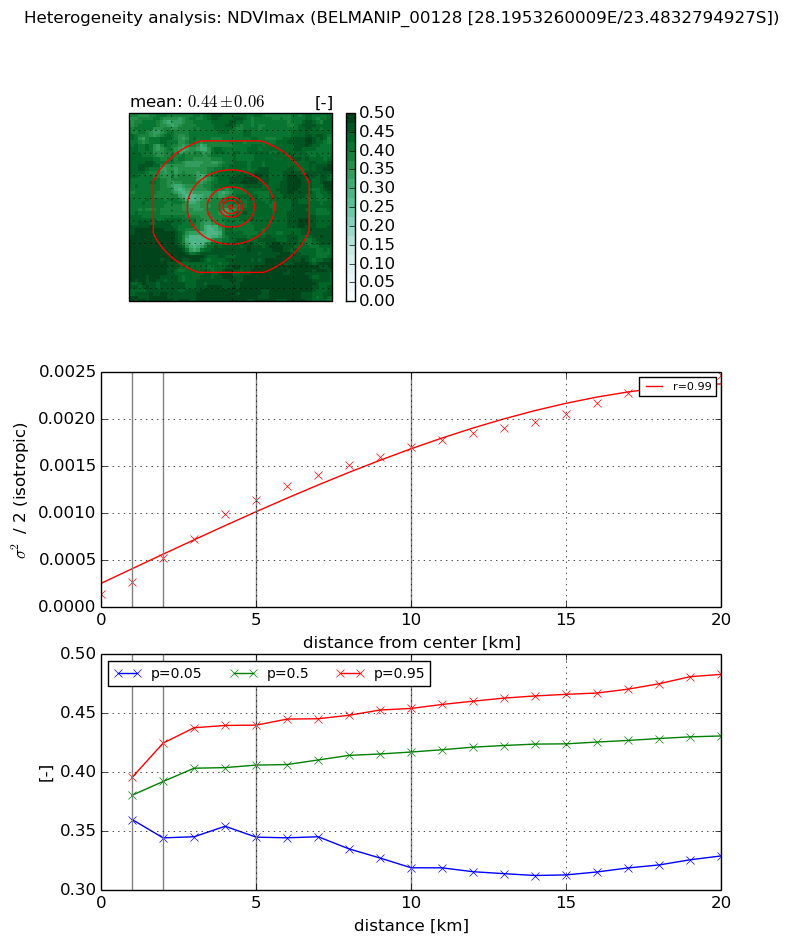
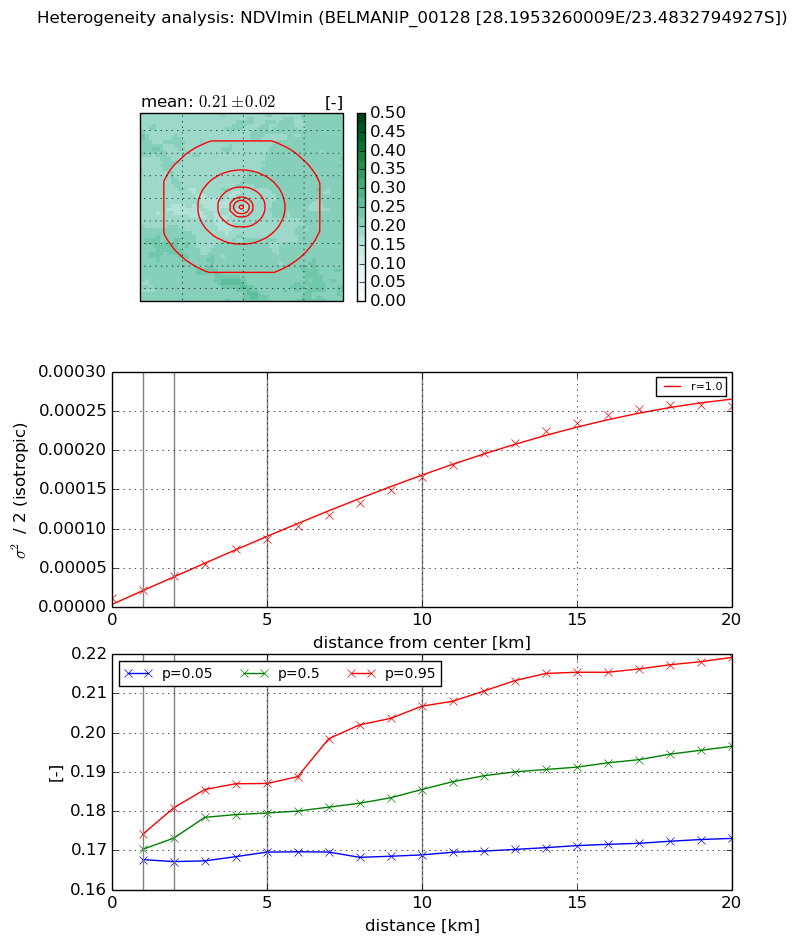
Heterogeneity analysis

The heterogeneity analysis provides information about the spatial and temporal heterogeneity of the site.

Topography


Roman et al. (2009) index


St

0.663559026689

Rcv

0.574815954249

Rse

0.0

Rst

2.35400979717e-05

Rsv

3.94623531488


Height range @ 1km [m]

10

Height range @ 2km [m]

23

Height range @ 5km [m]

52

Height range @ 10km [m]

-999

Height range @ 20km [m]

-999


Variance slope @ 1 km

29

Variance slope @ 2 km

38

Variance slope @ 5 km

64

Variance slope @ 10 km

-999

Variance slope @ 20 km

-999


NDVI (max. NDVI composite)


Roman et al. (2009) index


St

1.99103944955

Rcv

-0.0406594214554

Rse

0.0

Rst

-0.466091570064

Rsv

-0.999999666125


NDVI range @ 1km [-]

0.04

NDVI range @ 2km [-]

0.08

NDVI range @ 5km [-]

0.1

NDVI range @ 10km [-]

0.14

NDVI range @ 20km [-]

0.15


Variance slope @ 1 km

0.000126165978561

Variance slope @ 2 km

0.000190329683969

Variance slope @ 5 km

0.000211112419767

Variance slope @ 10 km

0.000161830942695

Variance slope @ 20 km

0.000110155168675


NDVI (min. NDVI composite)I


Roman et al. (2009) index


St

4.80336372551

Rcv

-0.142673915525

Rse

0.0

Rst

-0.145576896431

Rsv

0.336311509667


NDVI range @ 1km [-]

0.01

NDVI range @ 2km [-]

0.01

NDVI range @ 5km [-]

0.02

NDVI range @ 10km [-]

0.04

NDVI range @ 20km [-]

0.05


NDVI slope @ 1 km

9.98447596508e-06

NDVI slope @ 2 km

1.42274689149e-05

NDVI slope @ 5 km

1.56532362038e-05

NDVI slope @ 10 km

1.56163048136e-05

NDVI slope @ 20 km

1.34772389973e-05


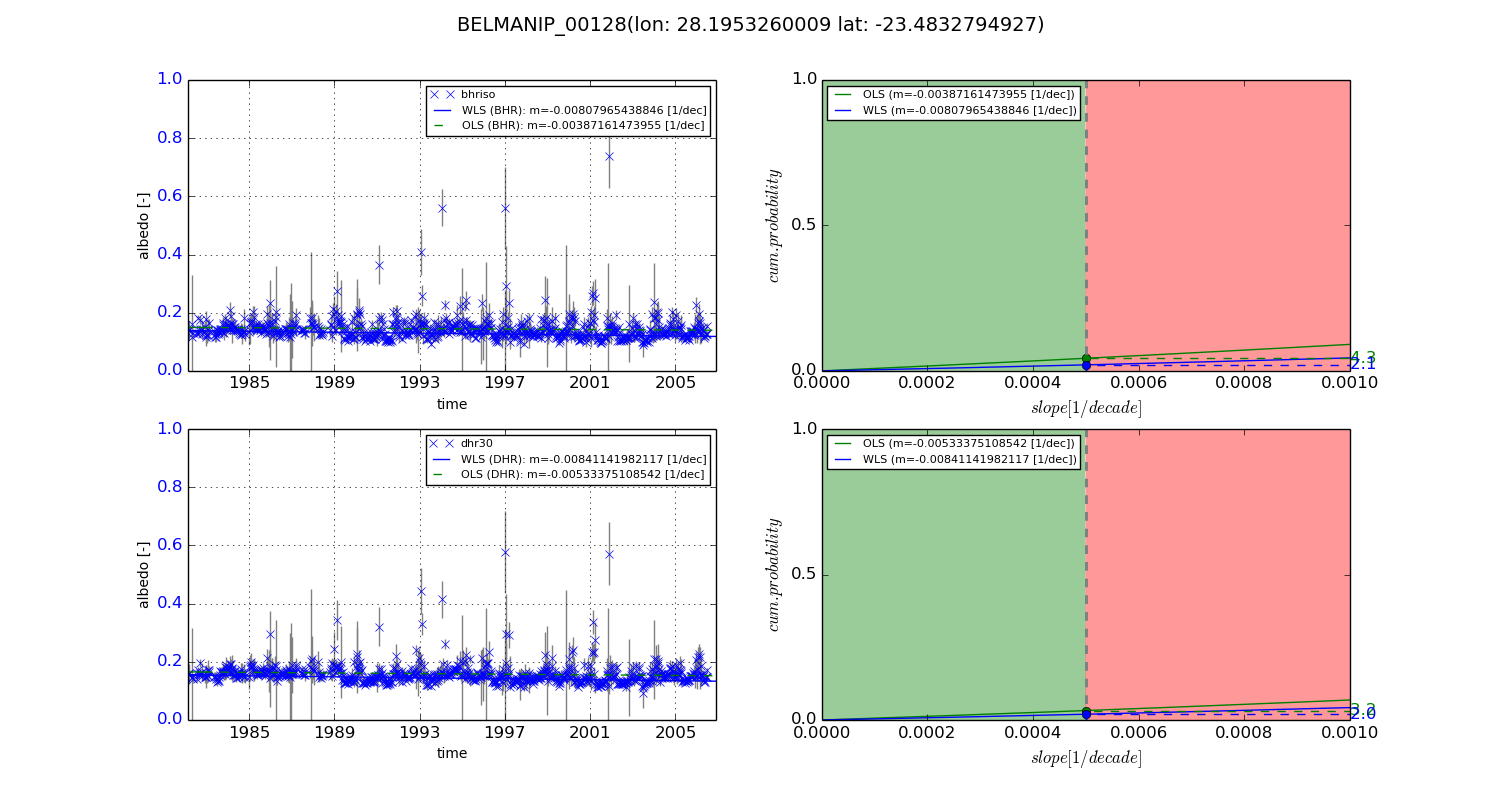
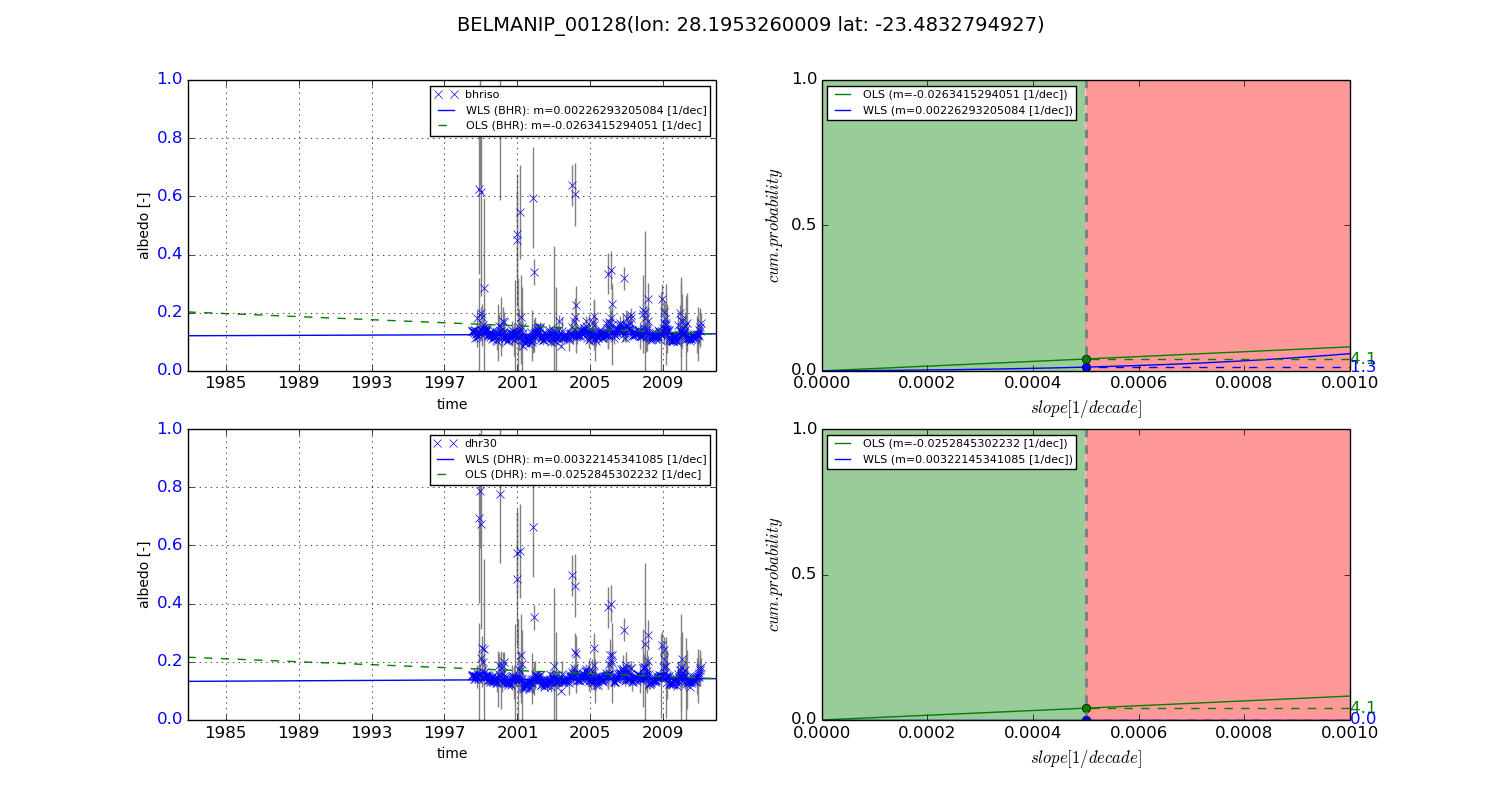
Temporal stability analysis

+000 deg (BHR)


BHR statistics

Temporal stability [1/decade]:


abs

rel


Weighted least square:

-0.00807965438846


Ordinary least square:

-0.00387161473955


Probabilities that GCOS criteria is met:

Weighted least square:

2.1 %

Ordinary least square:

4.3 %


DHR statistics

Temporal stability [1/decade]:


abs

rel


Weighted least square:

-0.00841141982117


Ordinary least square:

-0.00533375108542


Probabilities that GCOS criteria is met:

Weighted least square:

2.0 %

Ordinary least square:

3.2 %


+057/+063 deg (BHR)


BHR statistics

Temporal stability [1/decade]:


abs

rel


Weighted least square:

0.00226293205084


Ordinary least square:

-0.0263415294051


Probabilities that GCOS criteria is met:

Weighted least square:

1.3 %

Ordinary least square:

4.1 %


DHR statistics

Temporal stability [1/decade]:


abs

rel


Weighted least square:

0.00322145341085


Ordinary least square:

-0.0252845302232


Probabilities that GCOS criteria is met:

Weighted least square:

0.0 %

Ordinary least square:

4.1 %


Temporal anomaly analyis

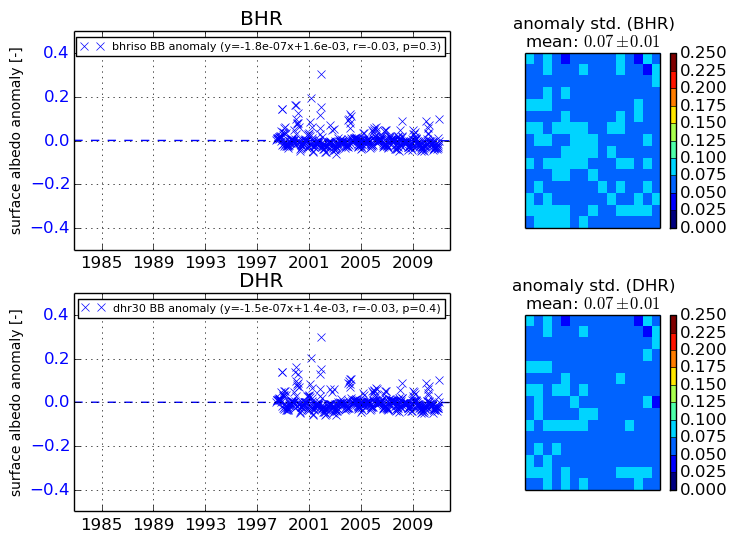
The variance of the temporal anomalies provides an additional measure about the stability of the signal AFTER removal of the mean seasonal cylce.
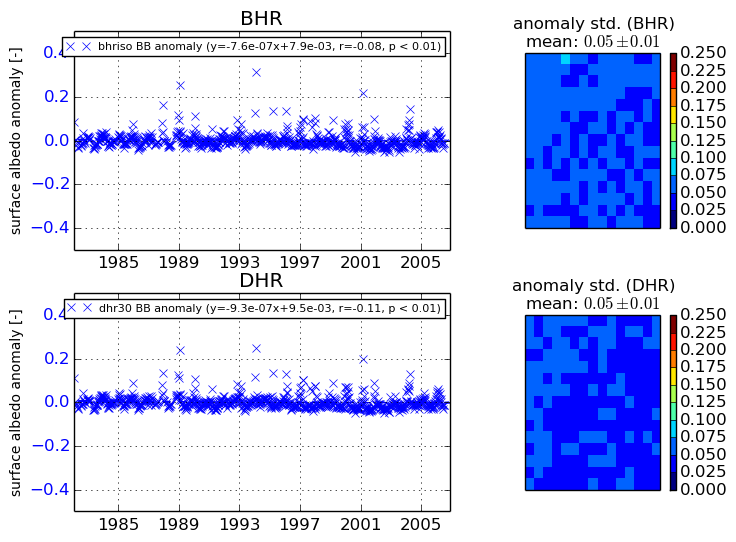
+000 deg


+057/+063 deg