BELMANIP_00129


Location

lon / lat [deg]: 18.6781 / -11.002

Source network: BELMANIP


Geostationary surface albedo (GSA) data


“+000”


“+057/+063”


Landcover information (based on ESA CCI landcover data)


Landcover fractions @ 2km distance


Landcover fractions @ 20 km distance


Legend


Distance to open water bodies [km]:

none in region

Distance to urban areas [km]:

none in region


Radius: 1 km

Number of landcover classes:

1

Dominant landcover type:

61: Tree cover, broadleaved, decidous (closed > 40%)

Fraction of dominant landcover type [%]:

100.0


Radius: 2 km

Number of landcover classes:

2

Dominant landcover type:

61: Tree cover, broadleaved, decidous (closed > 40%)

Fraction of dominant landcover type [%]:

90.0


Radius: 5 km

Number of landcover classes:

3

Dominant landcover type:

61: Tree cover, broadleaved, decidous (closed > 40%)

Fraction of dominant landcover type [%]:

82.0


Radius: 10 km

Number of landcover classes:

3

Dominant landcover type:

61: Tree cover, broadleaved, decidous (closed > 40%)

Fraction of dominant landcover type [%]:

79.0


Radius: 20 km

Number of landcover classes:

3

Dominant landcover type:

61: Tree cover, broadleaved, decidous (closed > 40%)

Fraction of dominant landcover type [%]:

70.0


Disturbances


Heterogeneity analysis

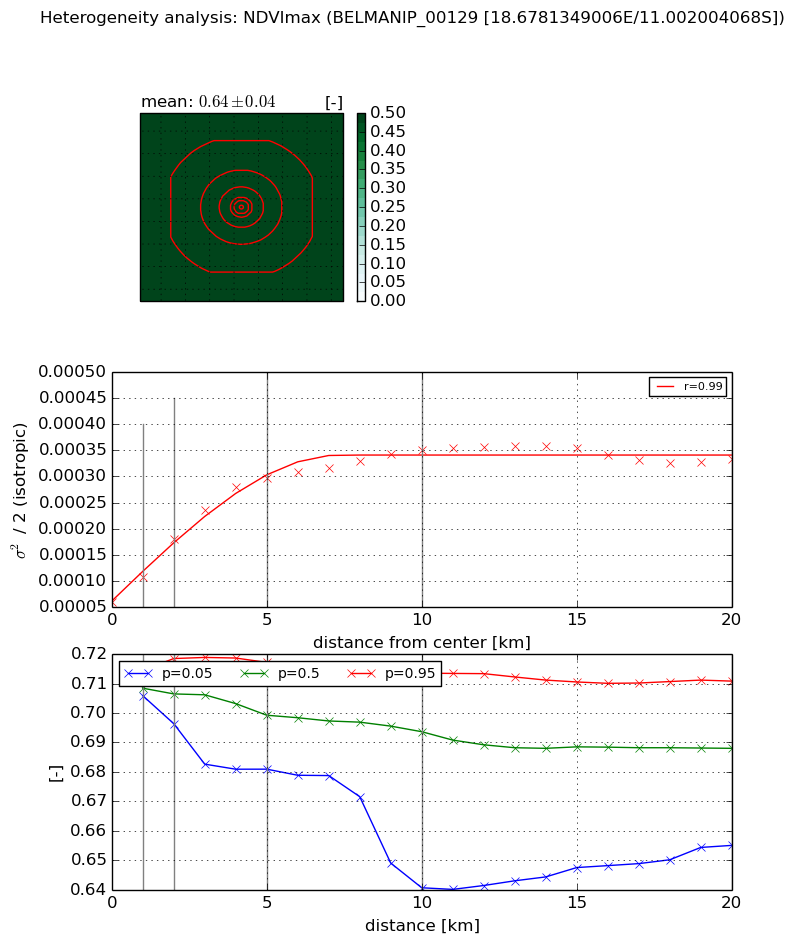
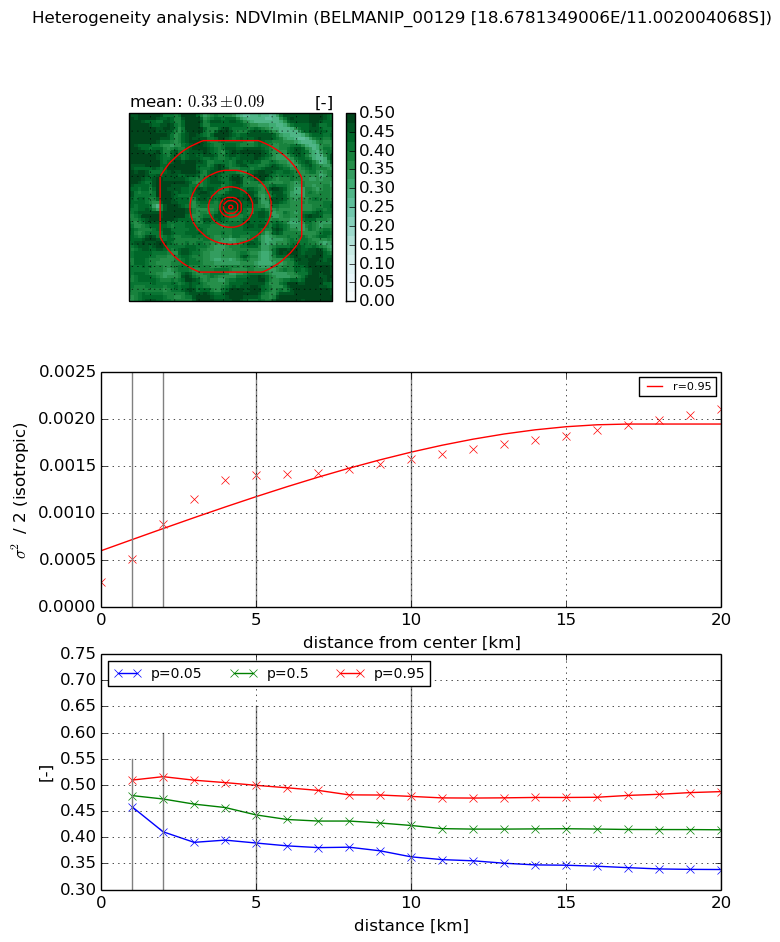
The heterogeneity analysis provides information about the spatial and temporal heterogeneity of the site.

Topography


Roman et al. (2009) index


St

1.94785560248

Rcv

0.540154175798

Rse

0.0

Rst

-1.05757151767e-06

Rsv

-0.999999999995


Height range @ 1km [m]

34

Height range @ 2km [m]

68

Height range @ 5km [m]

151

Height range @ 10km [m]

-999

Height range @ 20km [m]

-999


Variance slope @ 1 km

77

Variance slope @ 2 km

162

Variance slope @ 5 km

431

Variance slope @ 10 km

-999

Variance slope @ 20 km

-999


NDVI (max. NDVI composite)


Roman et al. (2009) index


St

8.70778625227

Rcv

0.118957851389

Rse

0.0

Rst

-0.130692735497

Rsv

0.0948686644013


NDVI range @ 1km [-]

0.01

NDVI range @ 2km [-]

0.02

NDVI range @ 5km [-]

0.04

NDVI range @ 10km [-]

0.07

NDVI range @ 20km [-]

0.06


Variance slope @ 1 km

4.78064353956e-05

Variance slope @ 2 km

6.07025724997e-05

Variance slope @ 5 km

5.04338143702e-05

Variance slope @ 10 km

2.75487868412e-05

Variance slope @ 20 km

9.86881357005e-06


NDVI (min. NDVI composite)I


Roman et al. (2009) index


St

6.87333034382

Rcv

-0.0633380480482

Rse

0.0

Rst

0.196754574473

Rsv

-0.176377014458


NDVI range @ 1km [-]

0.05

NDVI range @ 2km [-]

0.11

NDVI range @ 5km [-]

0.11

NDVI range @ 10km [-]

0.12

NDVI range @ 20km [-]

0.15


NDVI slope @ 1 km

0.0002370845897

NDVI slope @ 2 km

0.000304890097778

NDVI slope @ 5 km

0.000242187924159

NDVI slope @ 10 km

0.000117367419989

NDVI slope @ 20 km

7.08497953919e-05


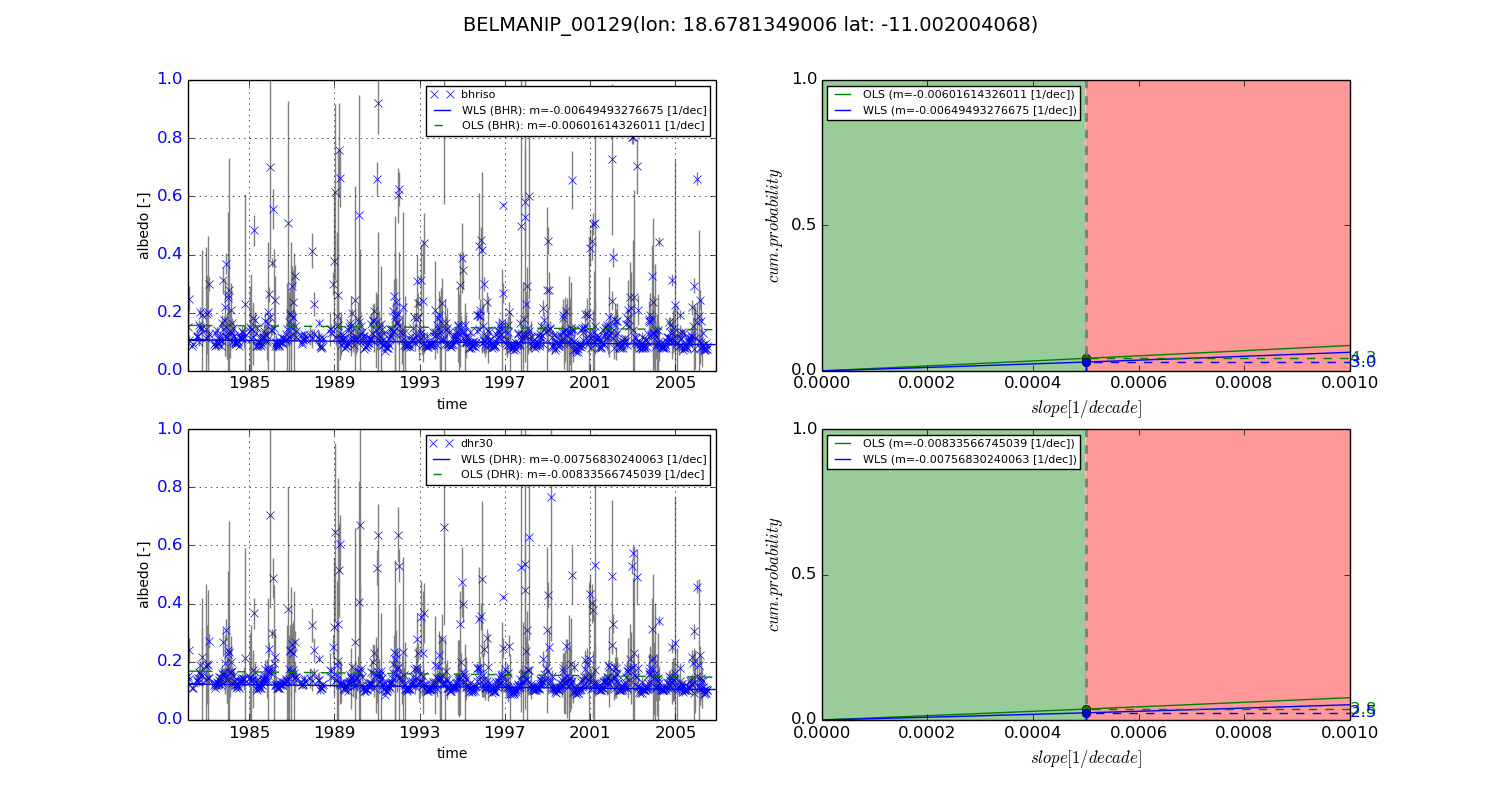
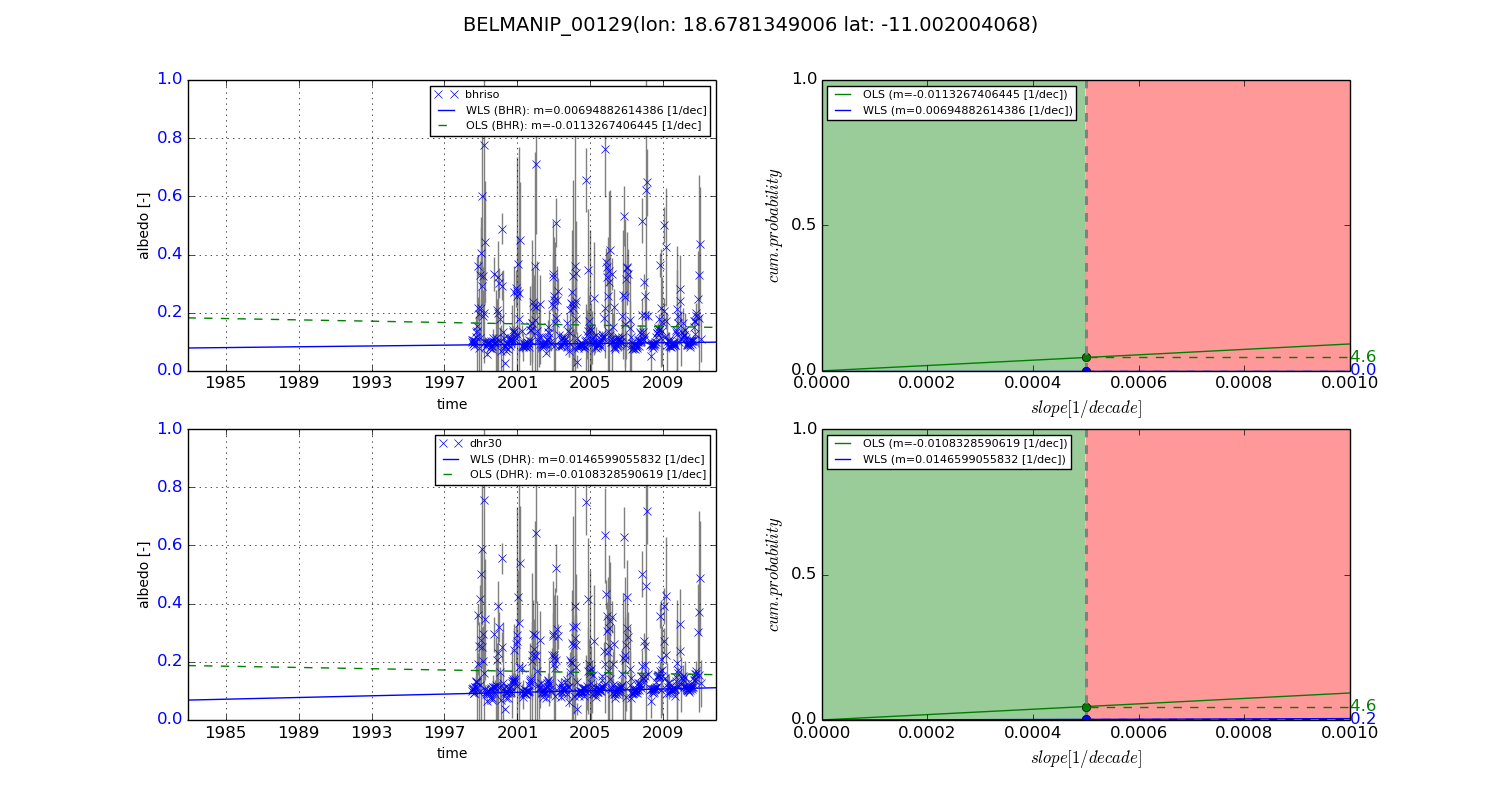
Temporal stability analysis

+000 deg (BHR)


BHR statistics

Temporal stability [1/decade]:


abs

rel


Weighted least square:

-0.00649493276675


Ordinary least square:

-0.00601614326011


Probabilities that GCOS criteria is met:

Weighted least square:

3.0 %

Ordinary least square:

4.3 %


DHR statistics

Temporal stability [1/decade]:


abs

rel


Weighted least square:

-0.00756830240063


Ordinary least square:

-0.00833566745039


Probabilities that GCOS criteria is met:

Weighted least square:

2.5 %

Ordinary least square:

3.8 %


+057/+063 deg (BHR)


BHR statistics

Temporal stability [1/decade]:


abs

rel


Weighted least square:

0.00694882614386


Ordinary least square:

-0.0113267406445


Probabilities that GCOS criteria is met:

Weighted least square:

0.0 %

Ordinary least square:

4.6 %


DHR statistics

Temporal stability [1/decade]:


abs

rel


Weighted least square:

0.0146599055832


Ordinary least square:

-0.0108328590619


Probabilities that GCOS criteria is met:

Weighted least square:

0.2 %

Ordinary least square:

4.6 %


Temporal anomaly analyis

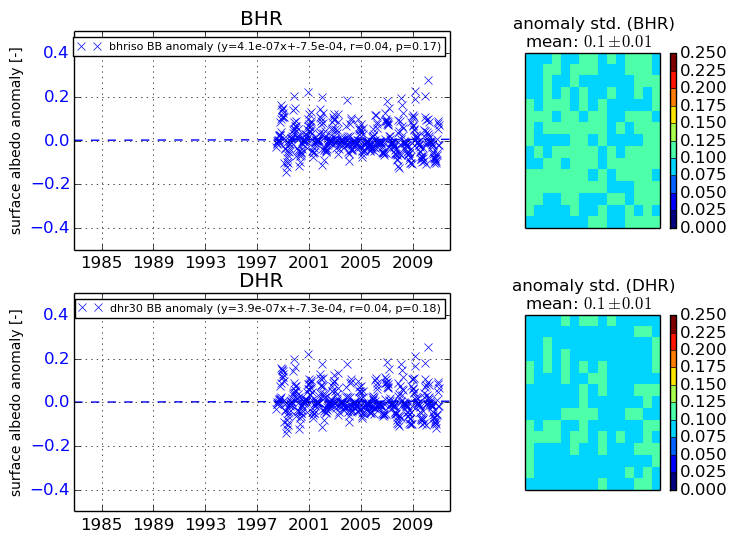
The variance of the temporal anomalies provides an additional measure about the stability of the signal AFTER removal of the mean seasonal cylce.
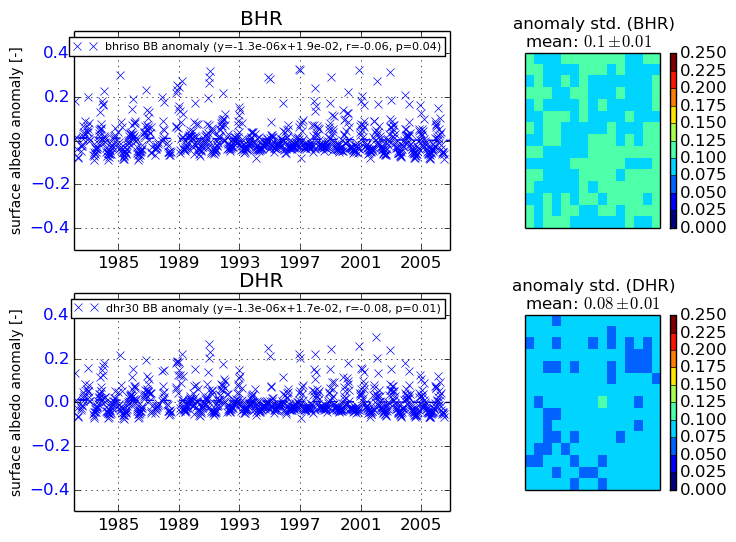
+000 deg


+057/+063 deg