BELMANIP_00130


Location

lon / lat [deg]: 29.1632 / -12.6618

Source network: BELMANIP


Geostationary surface albedo (GSA) data


“+000”


“+057/+063”


Landcover information (based on ESA CCI landcover data)


Landcover fractions @ 2km distance


Landcover fractions @ 20 km distance


Legend


Distance to open water bodies [km]:

29.93

Distance to urban areas [km]:

61.59


Radius: 1 km

Number of landcover classes:

2

Dominant landcover type:

61: Tree cover, broadleaved, decidous (closed > 40%)

Fraction of dominant landcover type [%]:

52.0


Radius: 2 km

Number of landcover classes:

3

Dominant landcover type:

60: Tree cover, broadleaved, decidous

Fraction of dominant landcover type [%]:

49.0


Radius: 5 km

Number of landcover classes:

3

Dominant landcover type:

60: Tree cover, broadleaved, decidous

Fraction of dominant landcover type [%]:

49.0


Radius: 10 km

Number of landcover classes:

3

Dominant landcover type:

61: Tree cover, broadleaved, decidous (closed > 40%)

Fraction of dominant landcover type [%]:

49.0


Radius: 20 km

Number of landcover classes:

3

Dominant landcover type:

61: Tree cover, broadleaved, decidous (closed > 40%)

Fraction of dominant landcover type [%]:

47.0


Disturbances


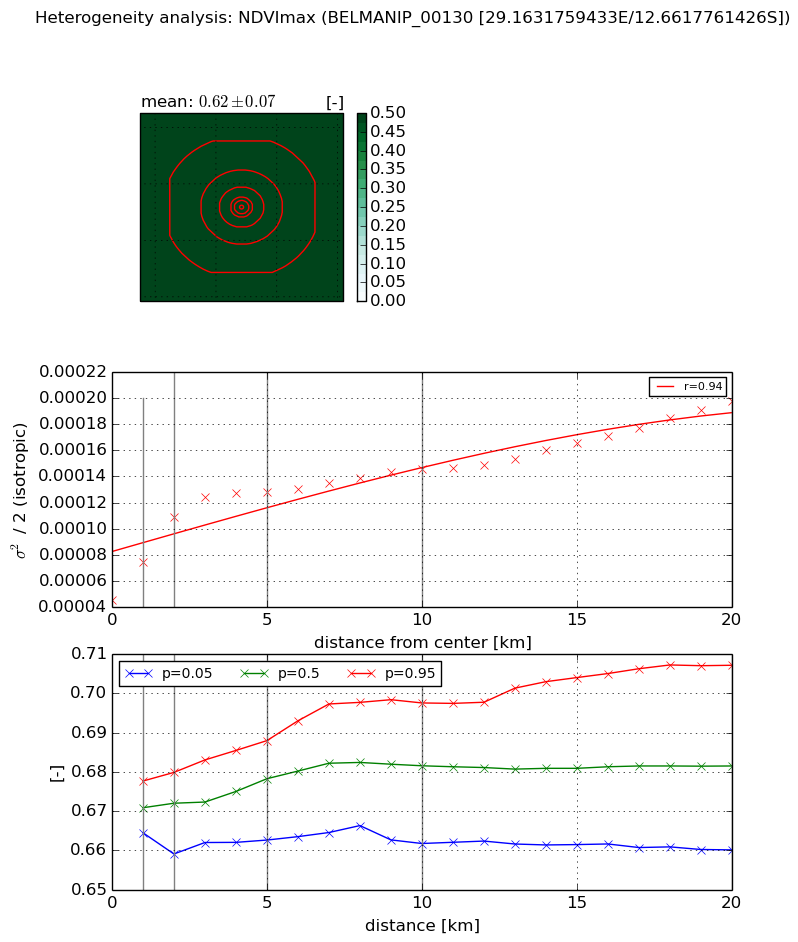
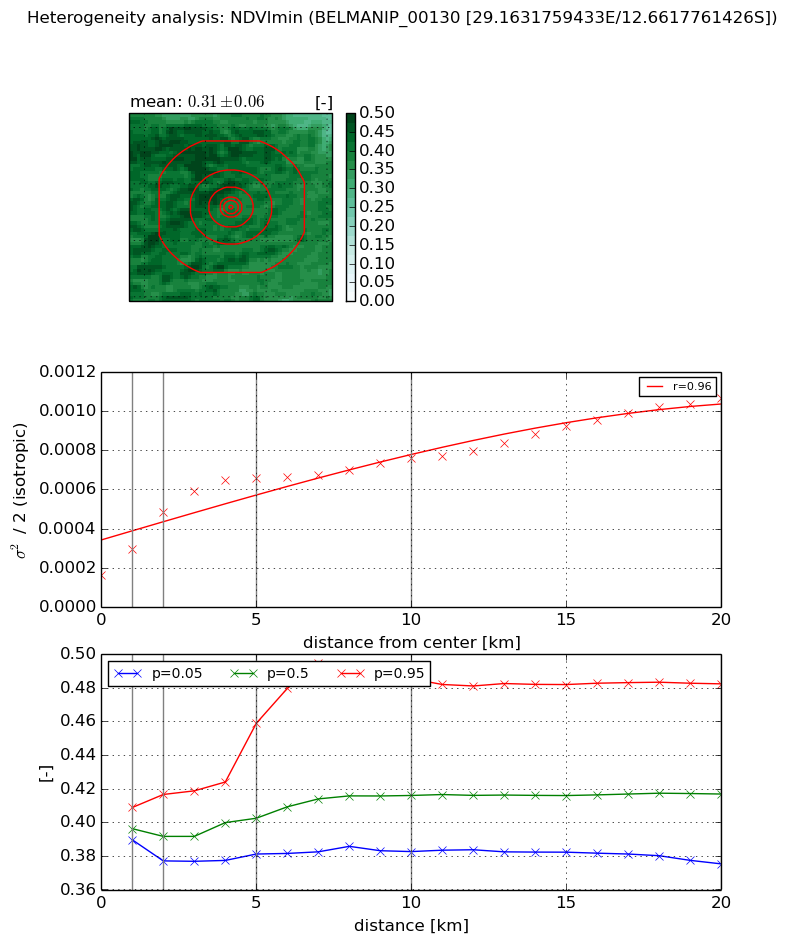
Heterogeneity analysis

The heterogeneity analysis provides information about the spatial and temporal heterogeneity of the site.

Topography


Roman et al. (2009) index


St

13.7027735571

Rcv

0.101366269383

Rse

0.0

Rst

-0.0553670202892

Rsv

0.0622004894993


Height range @ 1km [m]

23

Height range @ 2km [m]

41

Height range @ 5km [m]

48

Height range @ 10km [m]

-999

Height range @ 20km [m]

-999


Variance slope @ 1 km

73

Variance slope @ 2 km

91

Variance slope @ 5 km

62

Variance slope @ 10 km

-999

Variance slope @ 20 km

-999


NDVI (max. NDVI composite)


Roman et al. (2009) index


St

34.7655169137

Rcv

0.0634402589135

Rse

0.0

Rst

-0.00895205458771

Rsv

0.0139000896131


NDVI range @ 1km [-]

0.01

NDVI range @ 2km [-]

0.02

NDVI range @ 5km [-]

0.03

NDVI range @ 10km [-]

0.04

NDVI range @ 20km [-]

0.05


Variance slope @ 1 km

2.85905358305e-05

Variance slope @ 2 km

3.17781463434e-05

Variance slope @ 5 km

1.67166317117e-05

Variance slope @ 10 km

8.07146608604e-06

Variance slope @ 20 km

5.4395296464e-06


NDVI (min. NDVI composite)I


Roman et al. (2009) index


St

0.957515410022

Rcv

0.679294868368

Rse

0.0

Rst

-0.463391650598

Rsv

1.99042232565


NDVI range @ 1km [-]

0.02

NDVI range @ 2km [-]

0.04

NDVI range @ 5km [-]

0.08

NDVI range @ 10km [-]

0.1

NDVI range @ 20km [-]

0.11


NDVI slope @ 1 km

0.000133308729282

NDVI slope @ 2 km

0.000160860965099

NDVI slope @ 5 km

0.000103719052644

NDVI slope @ 10 km

5.02736384577e-05

NDVI slope @ 20 km

3.56843495523e-05


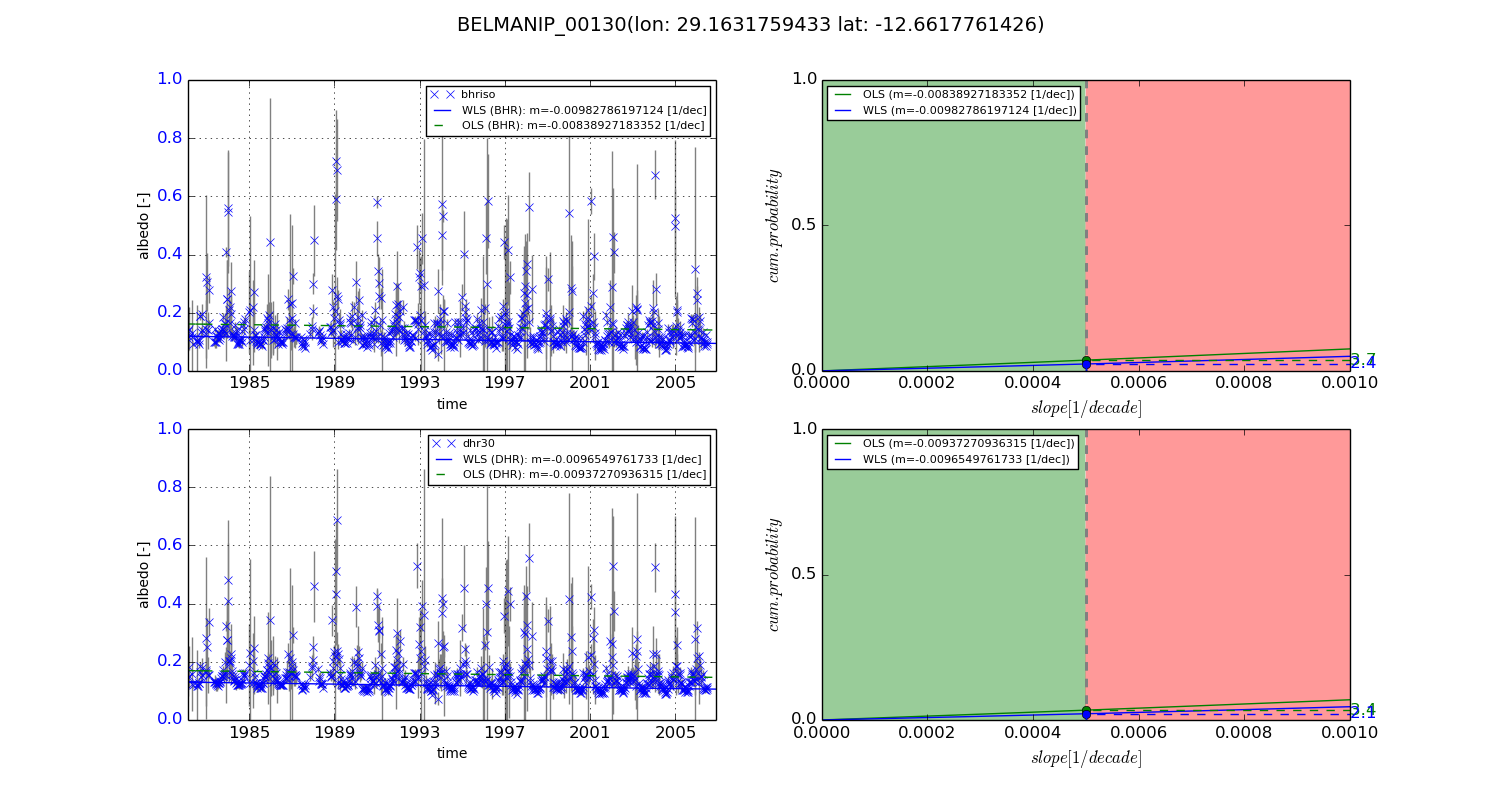
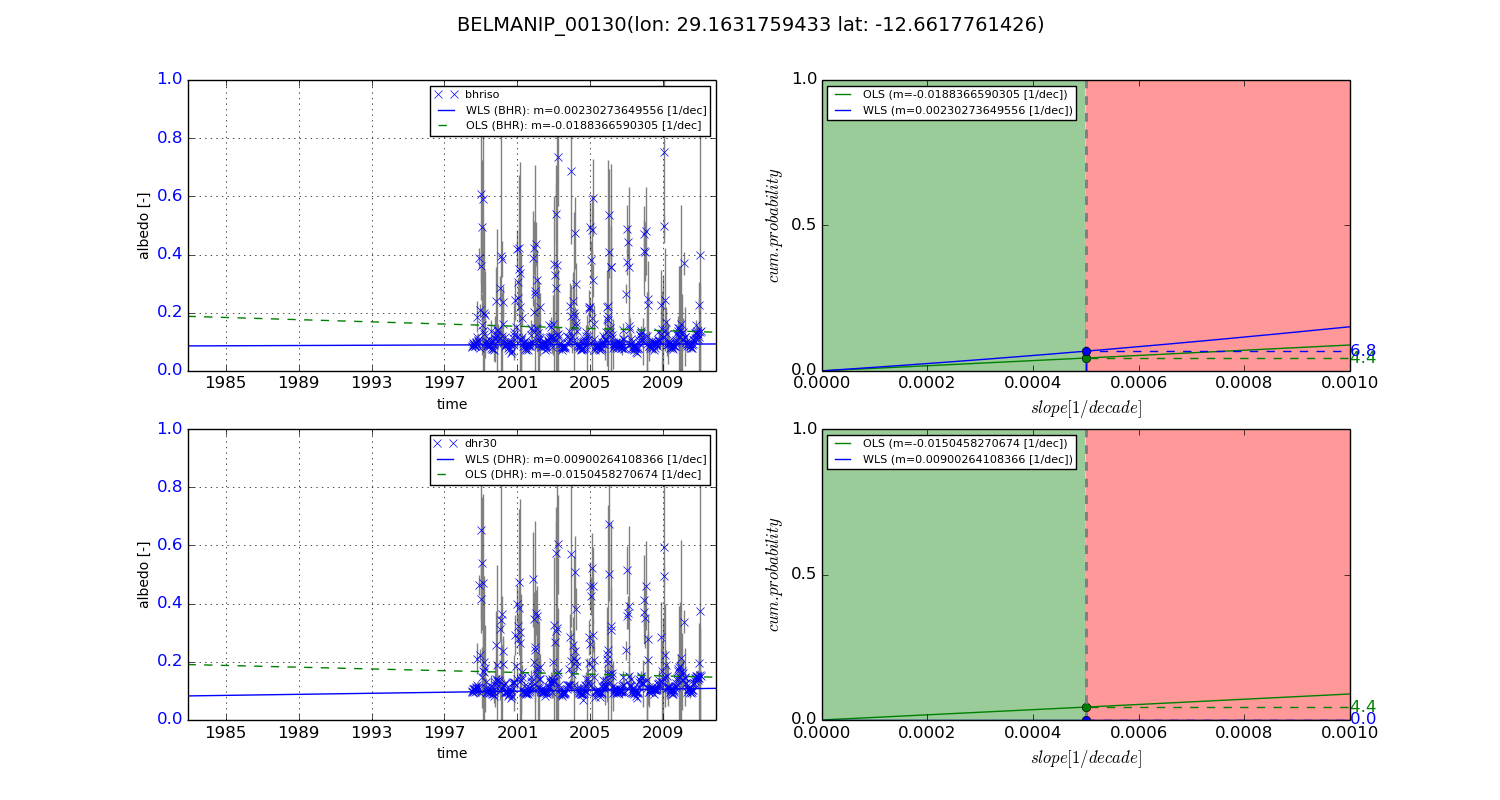
Temporal stability analysis

+000 deg (BHR)


BHR statistics

Temporal stability [1/decade]:


abs

rel


Weighted least square:

-0.00982786197124


Ordinary least square:

-0.00838927183352


Probabilities that GCOS criteria is met:

Weighted least square:

2.4 %

Ordinary least square:

3.7 %


DHR statistics

Temporal stability [1/decade]:


abs

rel


Weighted least square:

-0.0096549761733


Ordinary least square:

-0.00937270936315


Probabilities that GCOS criteria is met:

Weighted least square:

2.1 %

Ordinary least square:

3.4 %


+057/+063 deg (BHR)


BHR statistics

Temporal stability [1/decade]:


abs

rel


Weighted least square:

0.00230273649556


Ordinary least square:

-0.0188366590305


Probabilities that GCOS criteria is met:

Weighted least square:

6.8 %

Ordinary least square:

4.4 %


DHR statistics

Temporal stability [1/decade]:


abs

rel


Weighted least square:

0.00900264108366


Ordinary least square:

-0.0150458270674


Probabilities that GCOS criteria is met:

Weighted least square:

0.0 %

Ordinary least square:

4.4 %


Temporal anomaly analyis

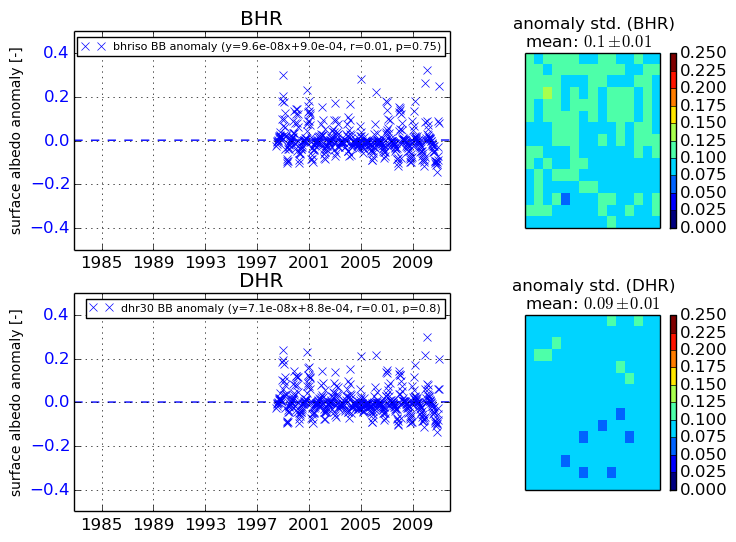
The variance of the temporal anomalies provides an additional measure about the stability of the signal AFTER removal of the mean seasonal cylce.
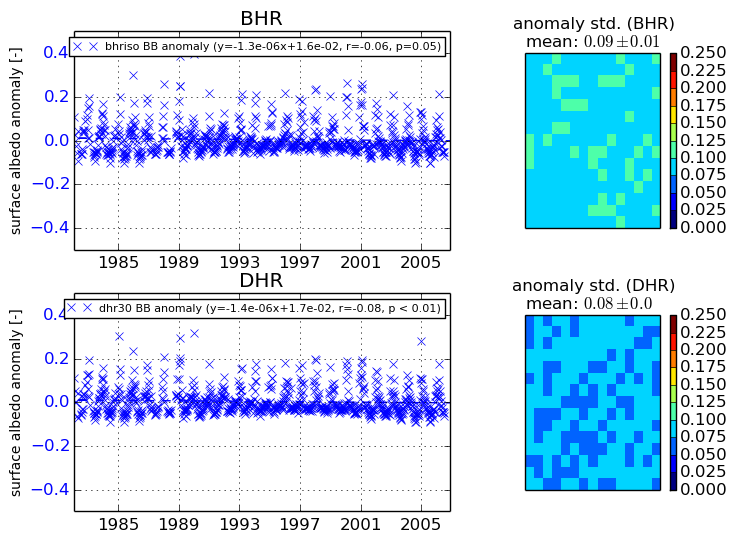
+000 deg


+057/+063 deg