BELMANIP_00134


Location

lon / lat [deg]: 16.8231 / -17.9764

Source network: BELMANIP


Geostationary surface albedo (GSA) data


“+000”


“+057/+063”


Landcover information (based on ESA CCI landcover data)


Landcover fractions @ 2km distance


Landcover fractions @ 20 km distance


Legend


Distance to open water bodies [km]:

10.38

Distance to urban areas [km]:

60.74


Radius: 1 km

Number of landcover classes:

2

Dominant landcover type:

130: grassland

Fraction of dominant landcover type [%]:

95.0


Radius: 2 km

Number of landcover classes:

2

Dominant landcover type:

130: grassland

Fraction of dominant landcover type [%]:

99.0


Radius: 5 km

Number of landcover classes:

2

Dominant landcover type:

130: grassland

Fraction of dominant landcover type [%]:

98.0


Radius: 10 km

Number of landcover classes:

2

Dominant landcover type:

130: grassland

Fraction of dominant landcover type [%]:

94.0


Radius: 20 km

Number of landcover classes:

2

Dominant landcover type:

130: grassland

Fraction of dominant landcover type [%]:

94.0


Disturbances


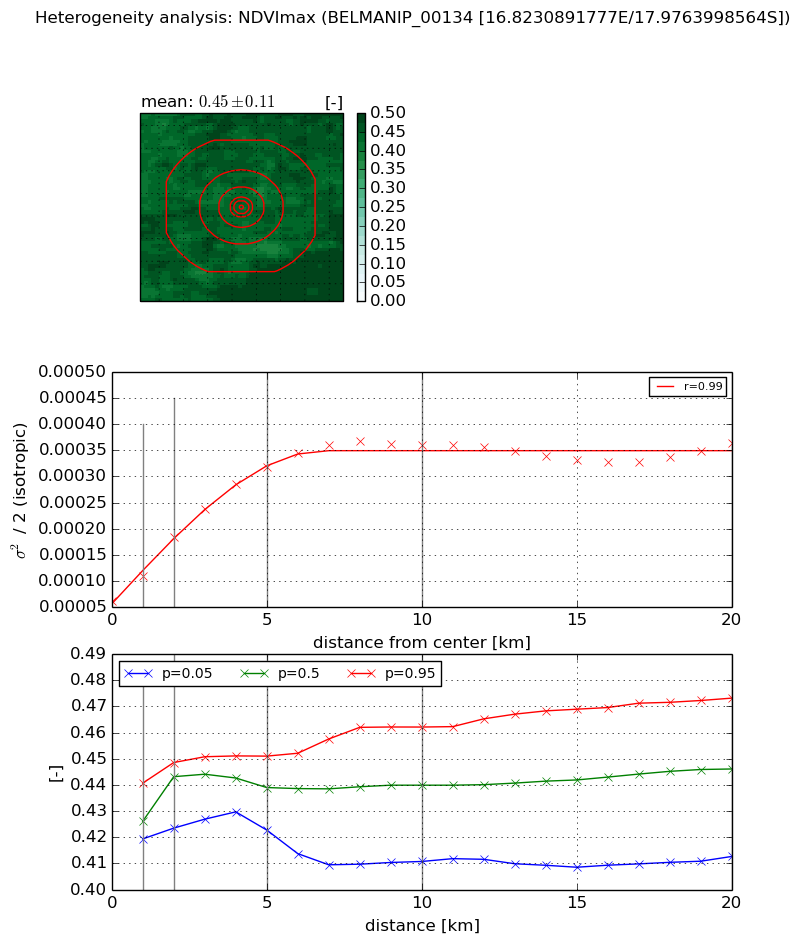
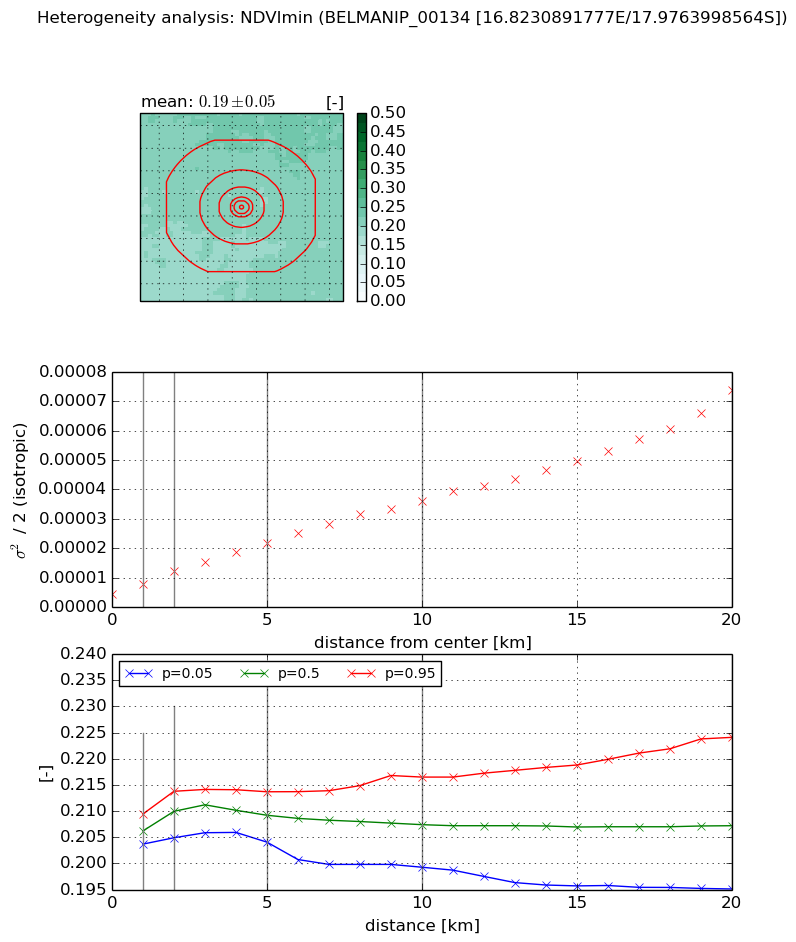
Heterogeneity analysis

The heterogeneity analysis provides information about the spatial and temporal heterogeneity of the site.

Topography


Roman et al. (2009) index


St

2.15715887124

Rcv

0.140356313711

Rse

0.0

Rst

0.250362205959

Rsv

-0.999999632802


Height range @ 1km [m]

6

Height range @ 2km [m]

8

Height range @ 5km [m]

7

Height range @ 10km [m]

-999

Height range @ 20km [m]

-999


Variance slope @ 1 km

2

Variance slope @ 2 km

1

Variance slope @ 5 km

0

Variance slope @ 10 km

-999

Variance slope @ 20 km

-999


NDVI (max. NDVI composite)


Roman et al. (2009) index


St

nan

Rcv

nan

Rse

nan

Rst

nan

Rsv

nan


NDVI range @ 1km [-]

0.02

NDVI range @ 2km [-]

0.03

NDVI range @ 5km [-]

0.03

NDVI range @ 10km [-]

0.05

NDVI range @ 20km [-]

0.06


Variance slope @ 1 km

4.75426125573e-05

Variance slope @ 2 km

6.08054744948e-05

Variance slope @ 5 km

5.32636890874e-05

Variance slope @ 10 km

3.04979702929e-05

Variance slope @ 20 km

9.41108409238e-06


NDVI (min. NDVI composite)I


Roman et al. (2009) index


St

0.874855032719

Rcv

0.0831602253927

Rse

0.0

Rst

2.31403719821

Rsv

1.03194213415


NDVI range @ 1km [-]

0.01

NDVI range @ 2km [-]

0.01

NDVI range @ 5km [-]

0.01

NDVI range @ 10km [-]

0.02

NDVI range @ 20km [-]

0.03


NDVI slope @ 1 km

3.18937371959e-06

NDVI slope @ 2 km

3.86380595219e-06

NDVI slope @ 5 km

3.47864789079e-06

NDVI slope @ 10 km

3.19244141096e-06

NDVI slope @ 20 km

3.1174708845e-06


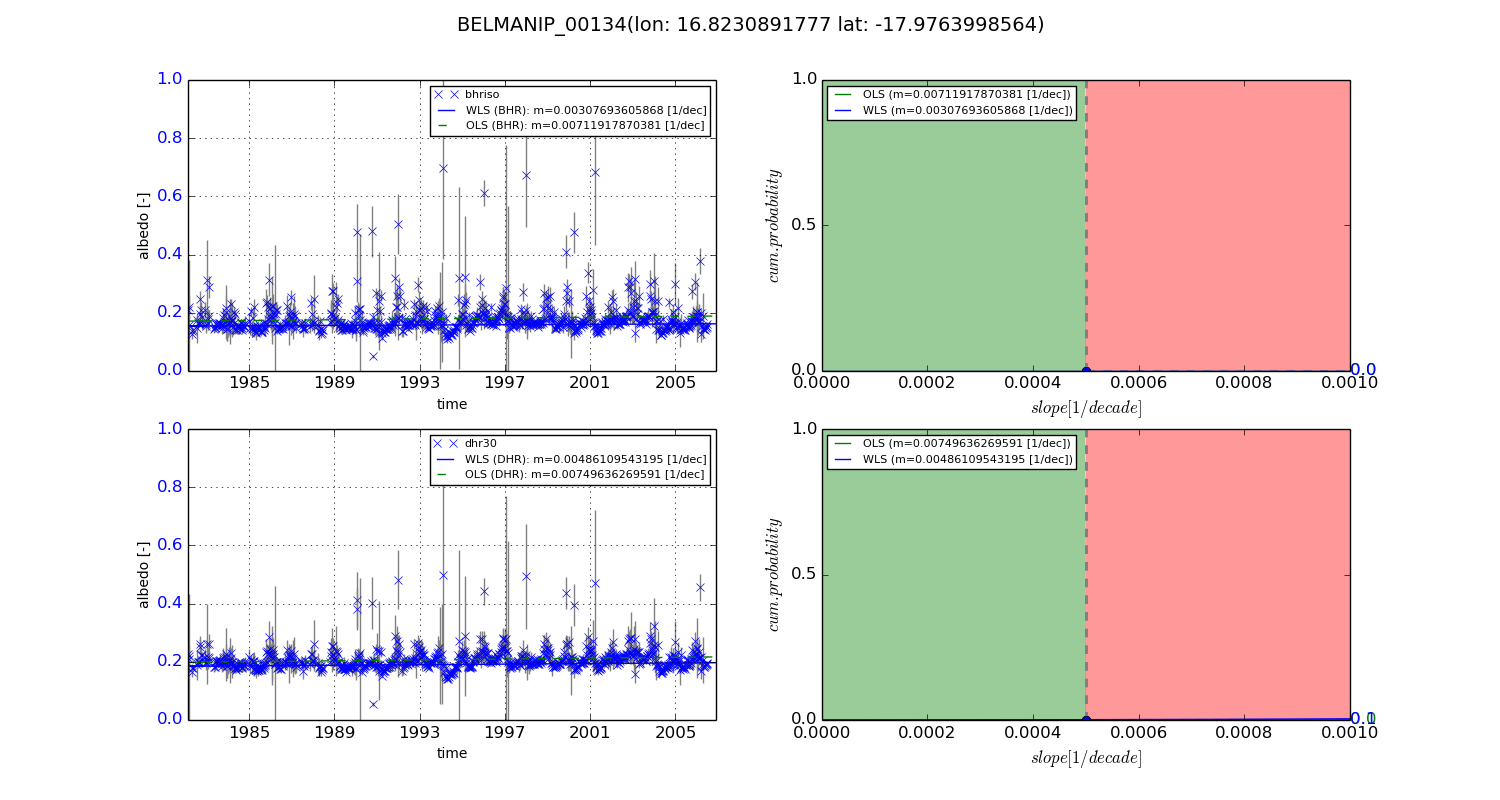
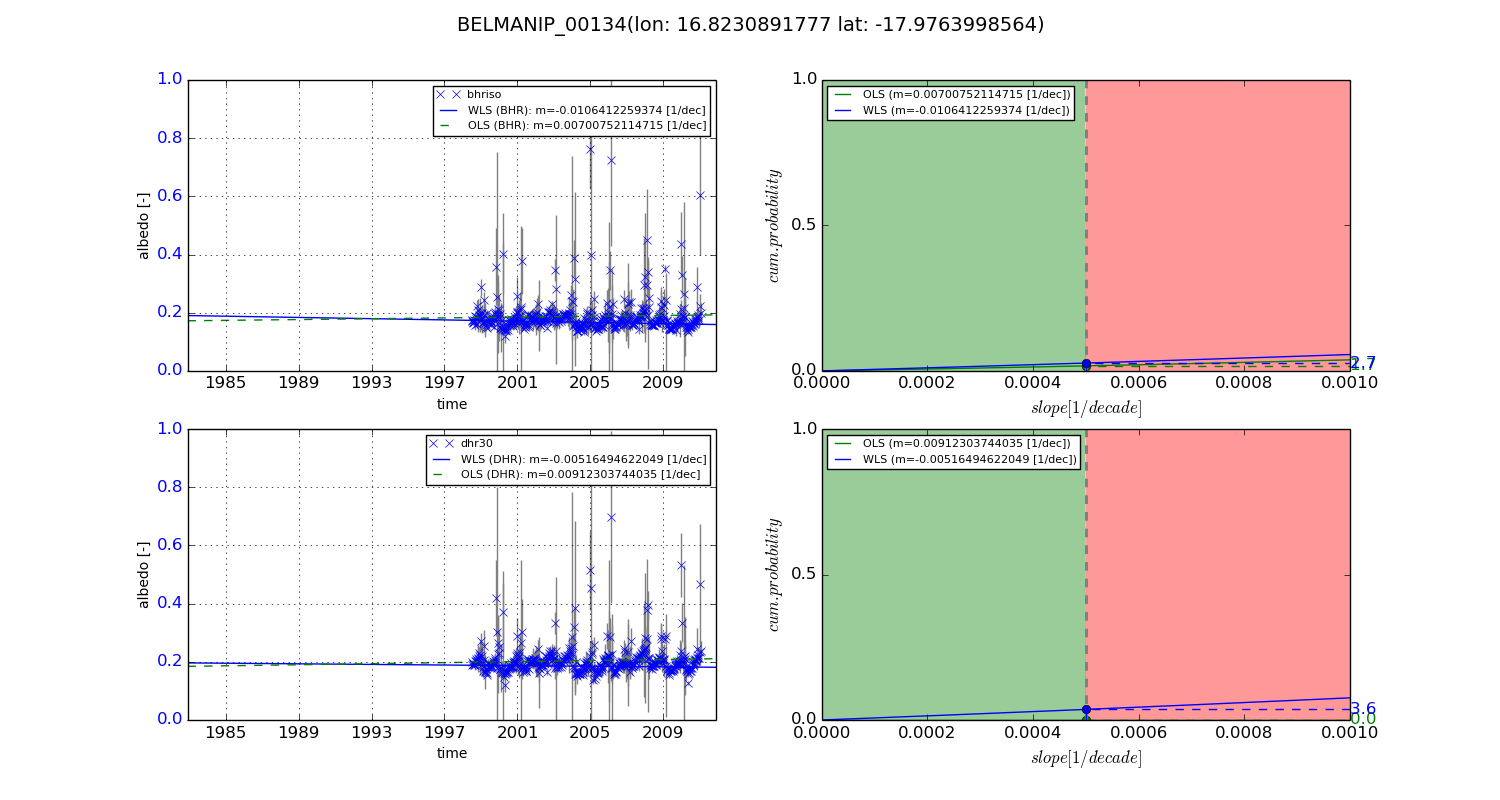
Temporal stability analysis

+000 deg (BHR)


BHR statistics

Temporal stability [1/decade]:


abs

rel


Weighted least square:

0.00307693605868


Ordinary least square:

0.00711917870381


Probabilities that GCOS criteria is met:

Weighted least square:

0.0 %

Ordinary least square:

0.0 %


DHR statistics

Temporal stability [1/decade]:


abs

rel


Weighted least square:

0.00486109543195


Ordinary least square:

0.00749636269591


Probabilities that GCOS criteria is met:

Weighted least square:

0.1 %

Ordinary least square:

0.0 %


+057/+063 deg (BHR)


BHR statistics

Temporal stability [1/decade]:


abs

rel


Weighted least square:

-0.0106412259374


Ordinary least square:

0.00700752114715


Probabilities that GCOS criteria is met:

Weighted least square:

2.7 %

Ordinary least square:

1.7 %


DHR statistics

Temporal stability [1/decade]:


abs

rel


Weighted least square:

-0.00516494622049


Ordinary least square:

0.00912303744035


Probabilities that GCOS criteria is met:

Weighted least square:

3.6 %

Ordinary least square:

0.0 %


Temporal anomaly analyis

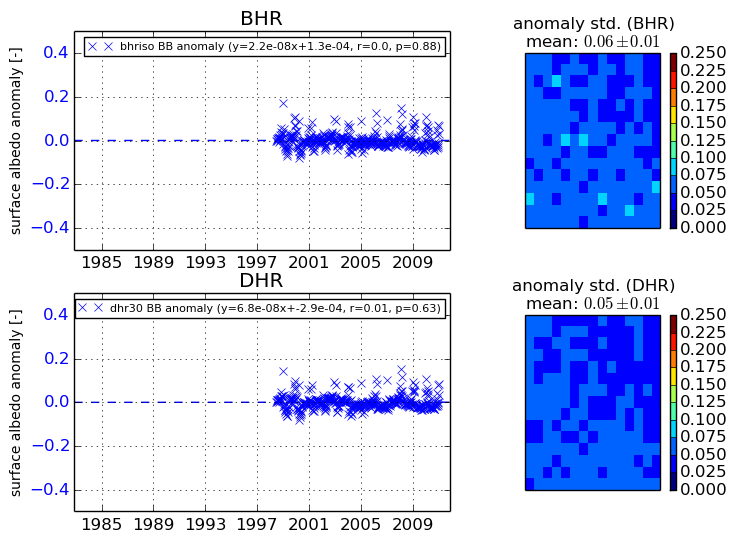
The variance of the temporal anomalies provides an additional measure about the stability of the signal AFTER removal of the mean seasonal cylce.
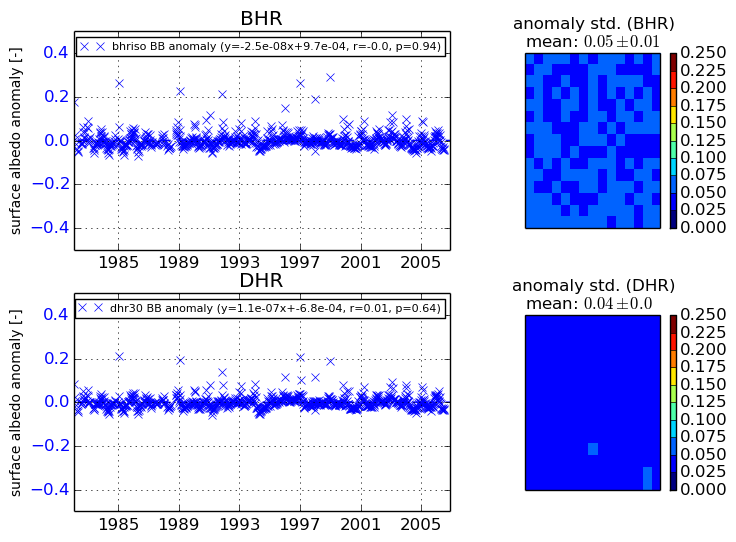
+000 deg


+057/+063 deg