BELMANIP_00135


Location

lon / lat [deg]: 23.598 / -18.8817

Source network: BELMANIP


Geostationary surface albedo (GSA) data


“+000”


“+057/+063”


Landcover information (based on ESA CCI landcover data)


Landcover fractions @ 2km distance


Landcover fractions @ 20 km distance


Legend


Distance to open water bodies [km]:

28.23

Distance to urban areas [km]:

none in region


Radius: 1 km

Number of landcover classes:

1

Dominant landcover type:

10: cropland, rainfed

Fraction of dominant landcover type [%]:

100.0


Radius: 2 km

Number of landcover classes:

1

Dominant landcover type:

10: cropland, rainfed

Fraction of dominant landcover type [%]:

100.0


Radius: 5 km

Number of landcover classes:

2

Dominant landcover type:

10: cropland, rainfed

Fraction of dominant landcover type [%]:

96.0


Radius: 10 km

Number of landcover classes:

2

Dominant landcover type:

10: cropland, rainfed

Fraction of dominant landcover type [%]:

98.0


Radius: 20 km

Number of landcover classes:

2

Dominant landcover type:

10: cropland, rainfed

Fraction of dominant landcover type [%]:

98.0


Disturbances


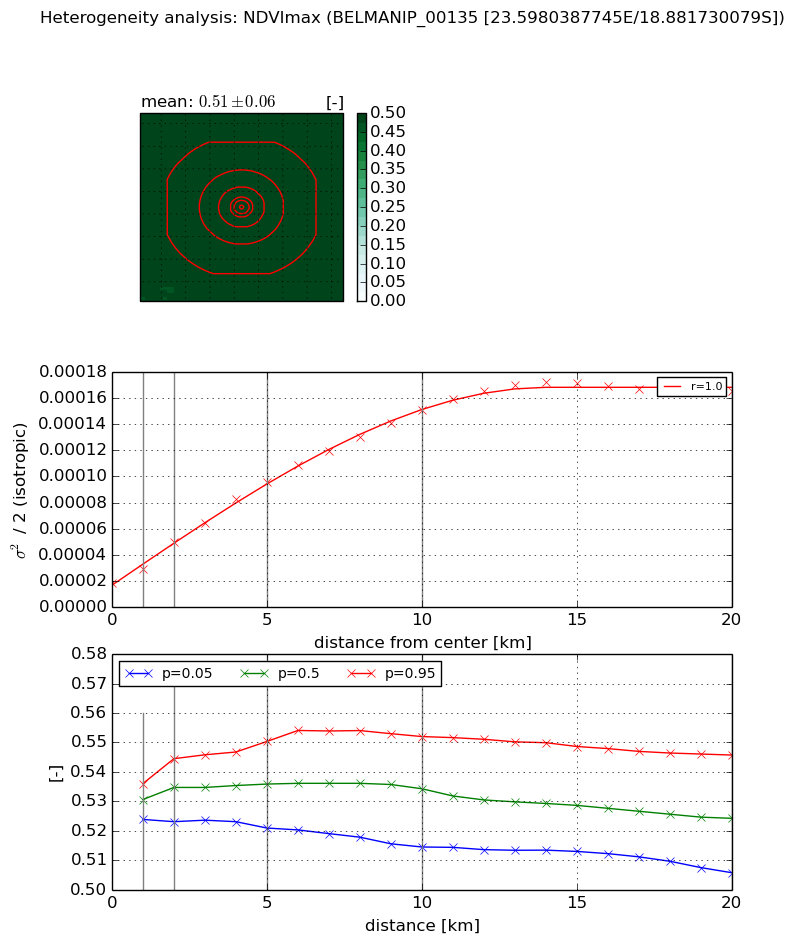
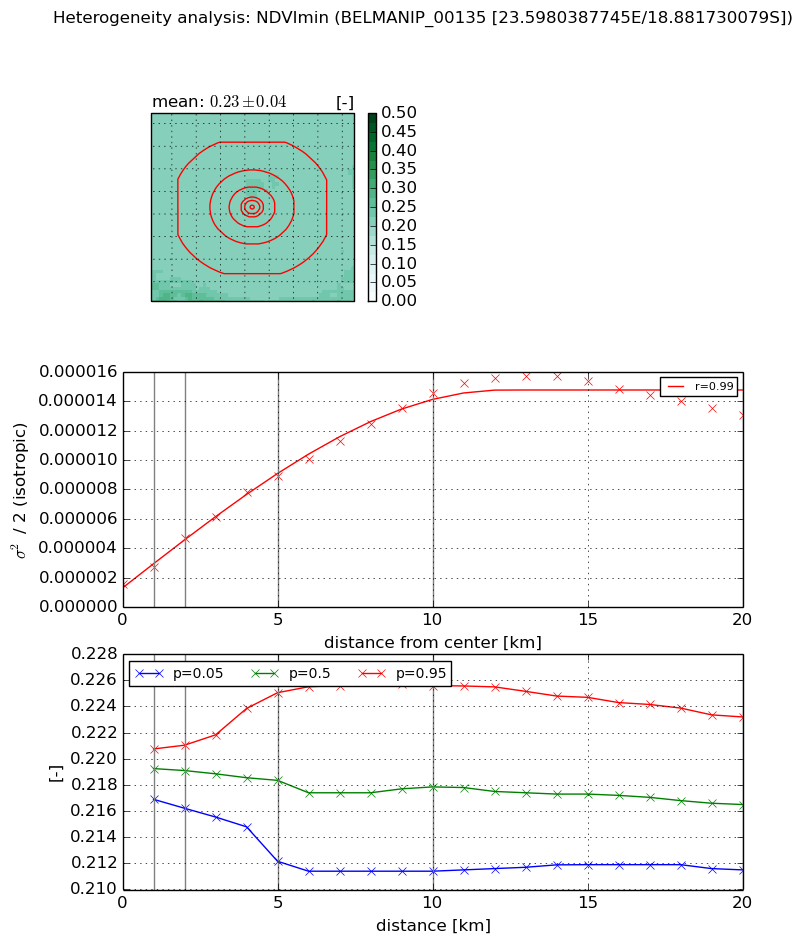
Heterogeneity analysis

The heterogeneity analysis provides information about the spatial and temporal heterogeneity of the site.

Topography


Roman et al. (2009) index


St

2.50170988691

Rcv

0.0806892455619

Rse

0.0

Rst

0.118496300289

Rsv

-0.999994269403


Height range @ 1km [m]

3

Height range @ 2km [m]

3

Height range @ 5km [m]

4

Height range @ 10km [m]

-999

Height range @ 20km [m]

-999


Variance slope @ 1 km

0

Variance slope @ 2 km

0

Variance slope @ 5 km

0

Variance slope @ 10 km

-999

Variance slope @ 20 km

-999


NDVI (max. NDVI composite)


Roman et al. (2009) index


St

3.38124848412

Rcv

0.334991446702

Rse

0.0

Rst

0.209713208028

Rsv

0.342541584074


NDVI range @ 1km [-]

0.01

NDVI range @ 2km [-]

0.02

NDVI range @ 5km [-]

0.03

NDVI range @ 10km [-]

0.04

NDVI range @ 20km [-]

0.04


Variance slope @ 1 km

1.12253380808e-05

Variance slope @ 2 km

1.57384803282e-05

Variance slope @ 5 km

1.60198735443e-05

Variance slope @ 10 km

1.35043732832e-05

Variance slope @ 20 km

7.43359998094e-06


NDVI (min. NDVI composite)I


Roman et al. (2009) index


St

1.57218197935

Rcv

0.870194806475

Rse

0.0

Rst

-0.0379819163485

Rsv

-0.999999327662


NDVI range @ 1km [-]

0.0

NDVI range @ 2km [-]

0.0

NDVI range @ 5km [-]

0.01

NDVI range @ 10km [-]

0.01

NDVI range @ 20km [-]

0.01


NDVI slope @ 1 km

1.15871687772e-06

NDVI slope @ 2 km

1.59215535845e-06

NDVI slope @ 5 km

1.52811748362e-06

NDVI slope @ 10 km

1.31013817124e-06

NDVI slope @ 20 km

6.01527303885e-07


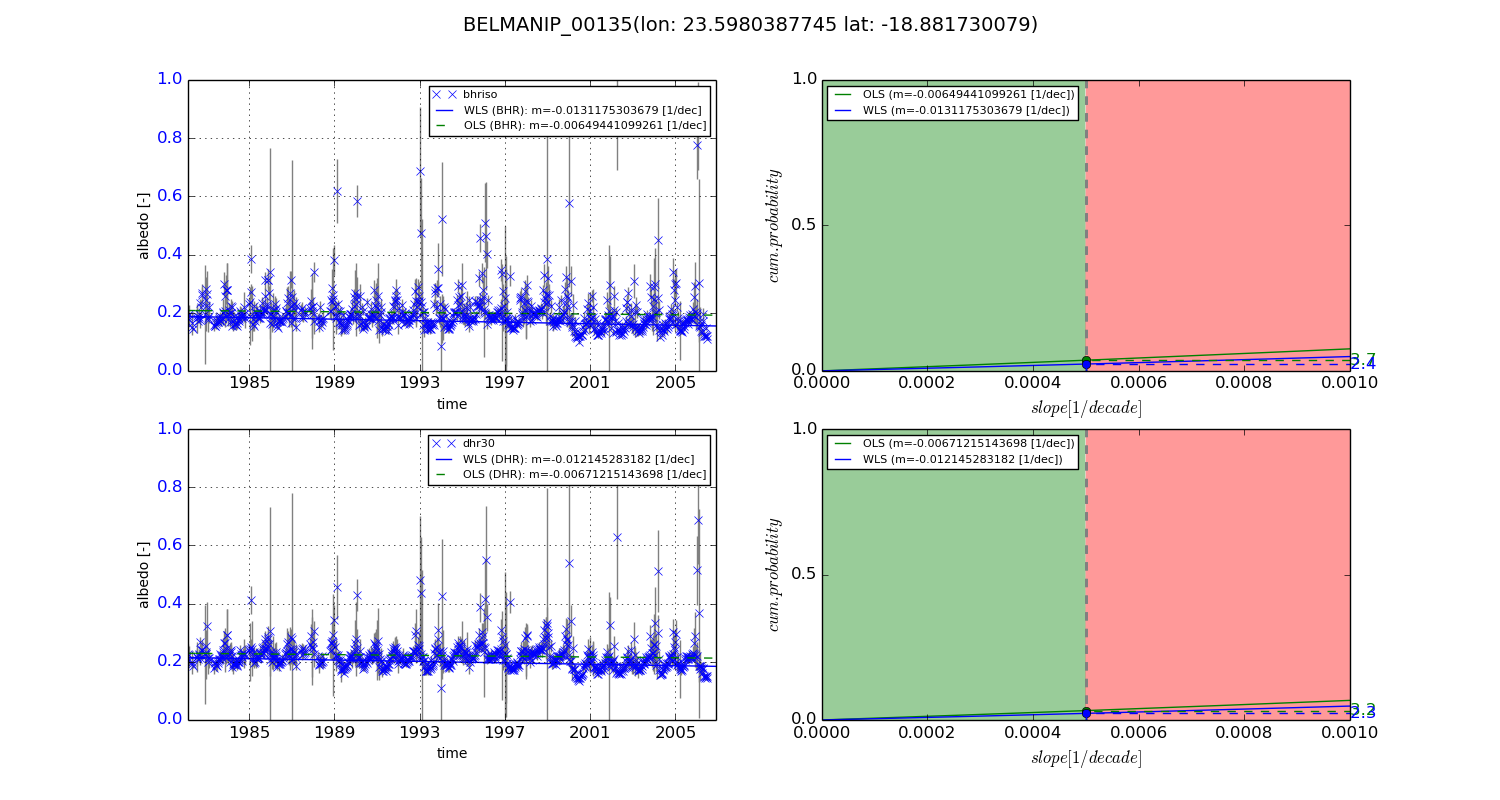
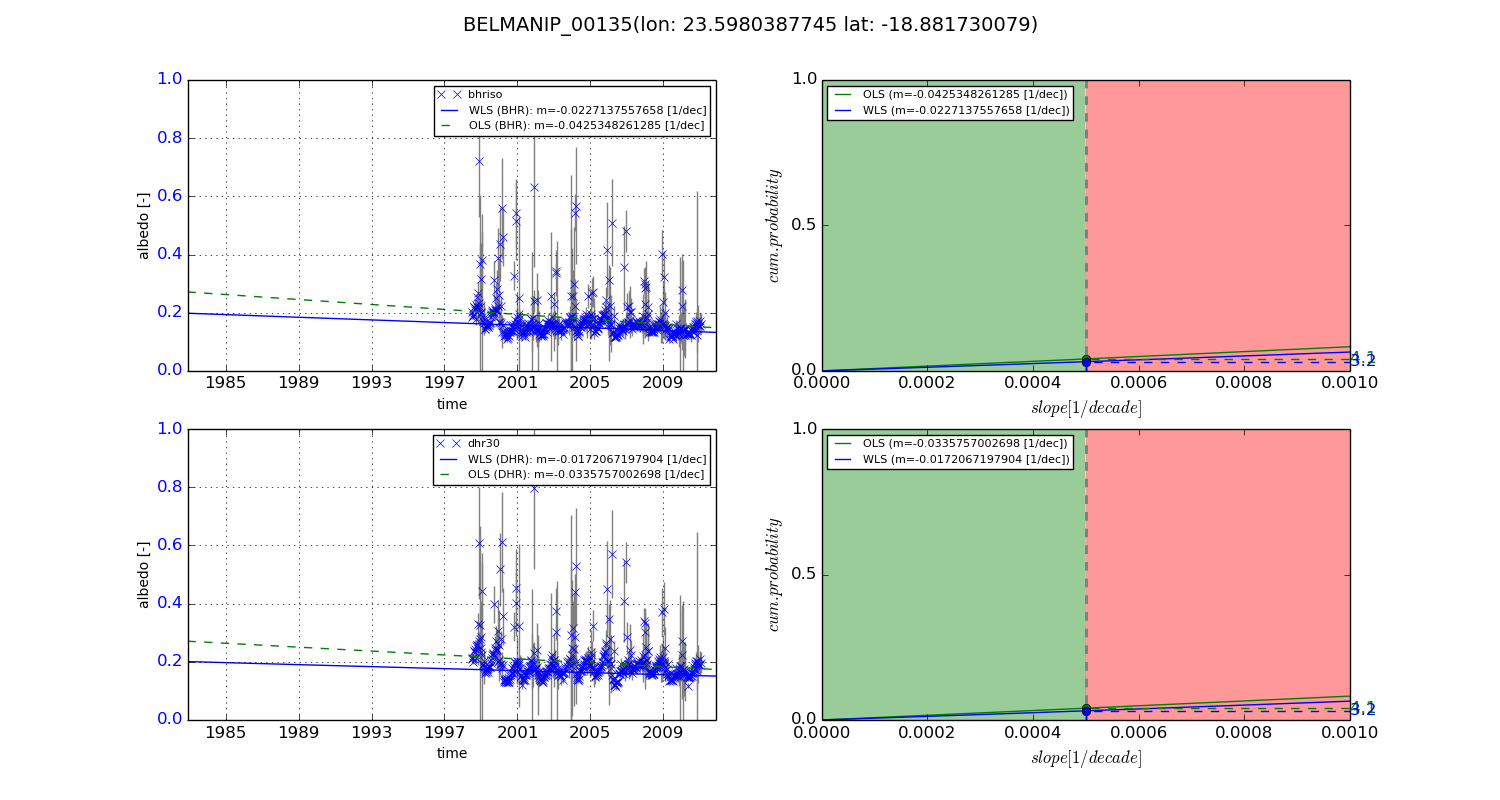
Temporal stability analysis

+000 deg (BHR)


BHR statistics

Temporal stability [1/decade]:


abs

rel


Weighted least square:

-0.0131175303679


Ordinary least square:

-0.00649441099261


Probabilities that GCOS criteria is met:

Weighted least square:

2.4 %

Ordinary least square:

3.7 %


DHR statistics

Temporal stability [1/decade]:


abs

rel


Weighted least square:

-0.012145283182


Ordinary least square:

-0.00671215143698


Probabilities that GCOS criteria is met:

Weighted least square:

2.3 %

Ordinary least square:

3.2 %


+057/+063 deg (BHR)


BHR statistics

Temporal stability [1/decade]:


abs

rel


Weighted least square:

-0.0227137557658


Ordinary least square:

-0.0425348261285


Probabilities that GCOS criteria is met:

Weighted least square:

3.2 %

Ordinary least square:

4.1 %


DHR statistics

Temporal stability [1/decade]:


abs

rel


Weighted least square:

-0.0172067197904


Ordinary least square:

-0.0335757002698


Probabilities that GCOS criteria is met:

Weighted least square:

3.2 %

Ordinary least square:

4.1 %


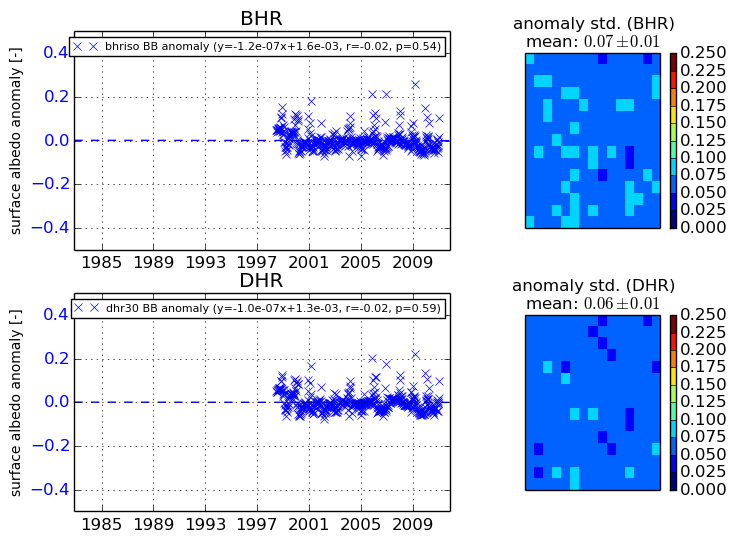
Temporal anomaly analyis

The variance of the temporal anomalies provides an additional measure about the stability of the signal AFTER removal of the mean seasonal cylce.
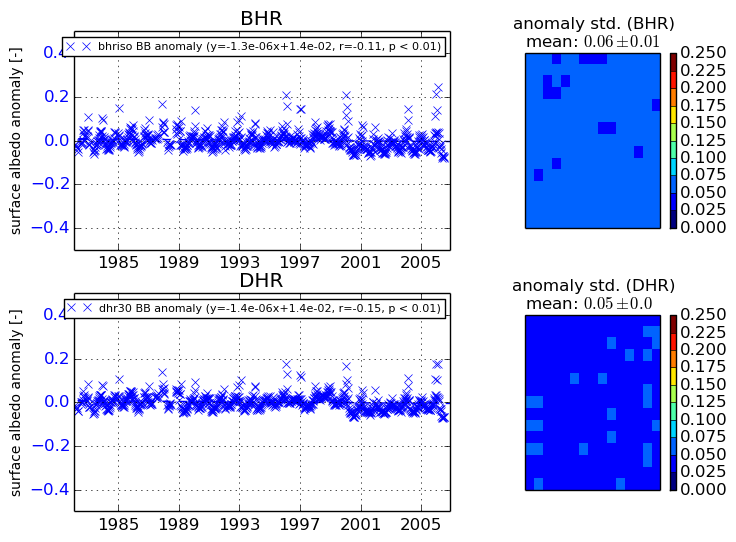
+000 deg


+057/+063 deg