BELMANIP_00136


Location

lon / lat [deg]: 44.4068 / -18.4626

Source network: BELMANIP


Geostationary surface albedo (GSA) data


“+000”


“+057/+063”


Landcover information (based on ESA CCI landcover data)


Landcover fractions @ 2km distance


Landcover fractions @ 20 km distance


Legend


Distance to open water bodies [km]:

22.31

Distance to urban areas [km]:

57.39


Radius: 1 km

Number of landcover classes:

1

Dominant landcover type:

120: Shrubland

Fraction of dominant landcover type [%]:

100.0


Radius: 2 km

Number of landcover classes:

3

Dominant landcover type:

120: Shrubland

Fraction of dominant landcover type [%]:

96.0


Radius: 5 km

Number of landcover classes:

3

Dominant landcover type:

120: Shrubland

Fraction of dominant landcover type [%]:

97.0


Radius: 10 km

Number of landcover classes:

4

Dominant landcover type:

120: Shrubland

Fraction of dominant landcover type [%]:

89.0


Radius: 20 km

Number of landcover classes:

5

Dominant landcover type:

120: Shrubland

Fraction of dominant landcover type [%]:

87.0


Disturbances


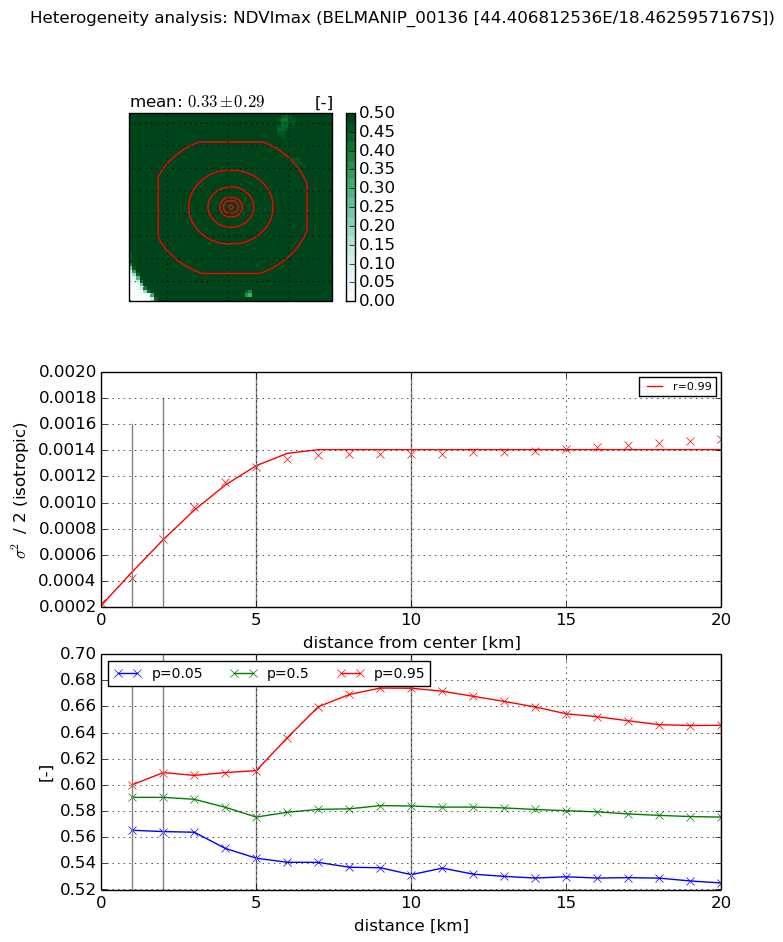
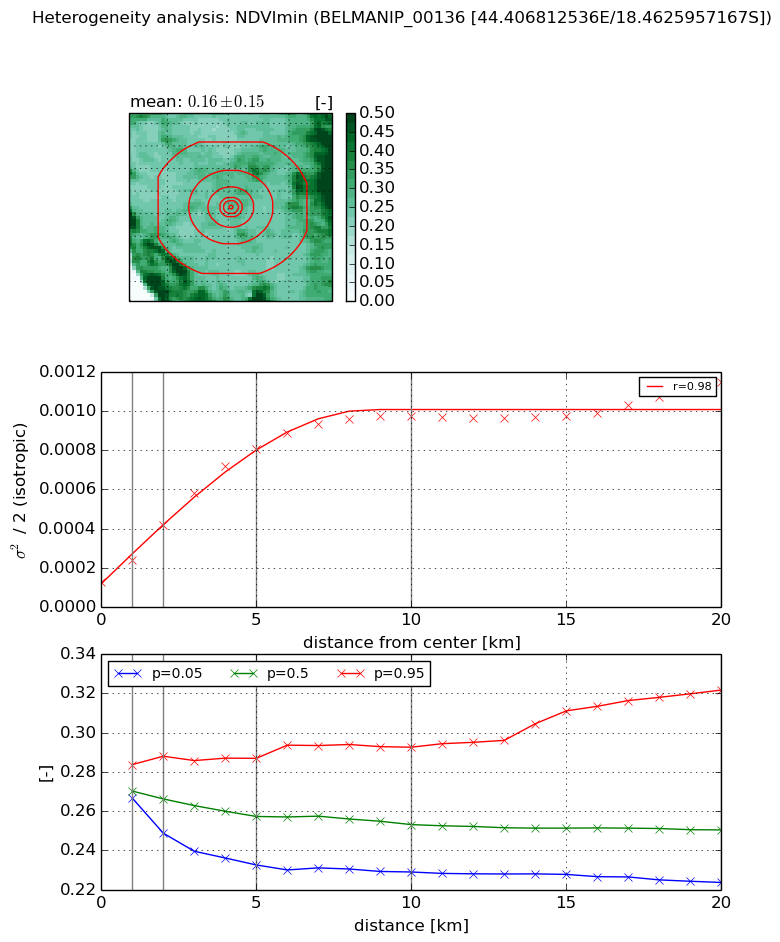
Heterogeneity analysis

The heterogeneity analysis provides information about the spatial and temporal heterogeneity of the site.

Topography


Roman et al. (2009) index


St

1.64503986152

Rcv

0.823770861443

Rse

0.0

Rst

-1.62612972232e-05

Rsv

-0.999876893053


Height range @ 1km [m]

23

Height range @ 2km [m]

35

Height range @ 5km [m]

101

Height range @ 10km [m]

-999

Height range @ 20km [m]

-999


Variance slope @ 1 km

176

Variance slope @ 2 km

184

Variance slope @ 5 km

149

Variance slope @ 10 km

-999

Variance slope @ 20 km

-999


NDVI (max. NDVI composite)


Roman et al. (2009) index


St

0.668000960095

Rcv

0.643010159604

Rse

0.0

Rst

-0.536793339214

Rsv

3.31120801046


NDVI range @ 1km [-]

0.03

NDVI range @ 2km [-]

0.05

NDVI range @ 5km [-]

0.07

NDVI range @ 10km [-]

0.14

NDVI range @ 20km [-]

0.12


Variance slope @ 1 km

0.000191240074461

Variance slope @ 2 km

0.000244549601121

Variance slope @ 5 km

0.000217888680101

Variance slope @ 10 km

0.000112542043233

Variance slope @ 20 km

4.37536890472e-05


NDVI (min. NDVI composite)I


Roman et al. (2009) index


St

1.92079553753e-07

Rcv

0.134558610251

Rse

0.0

Rst

0.260419891236

Rsv

15618528.1854


NDVI range @ 1km [-]

0.02

NDVI range @ 2km [-]

0.04

NDVI range @ 5km [-]

0.05

NDVI range @ 10km [-]

0.06

NDVI range @ 20km [-]

0.1


NDVI slope @ 1 km

0.000108838633263

NDVI slope @ 2 km

0.000143399320204

NDVI slope @ 5 km

0.000142547681222

NDVI slope @ 10 km

8.7741545641e-05

NDVI slope @ 20 km

3.7986504488e-05


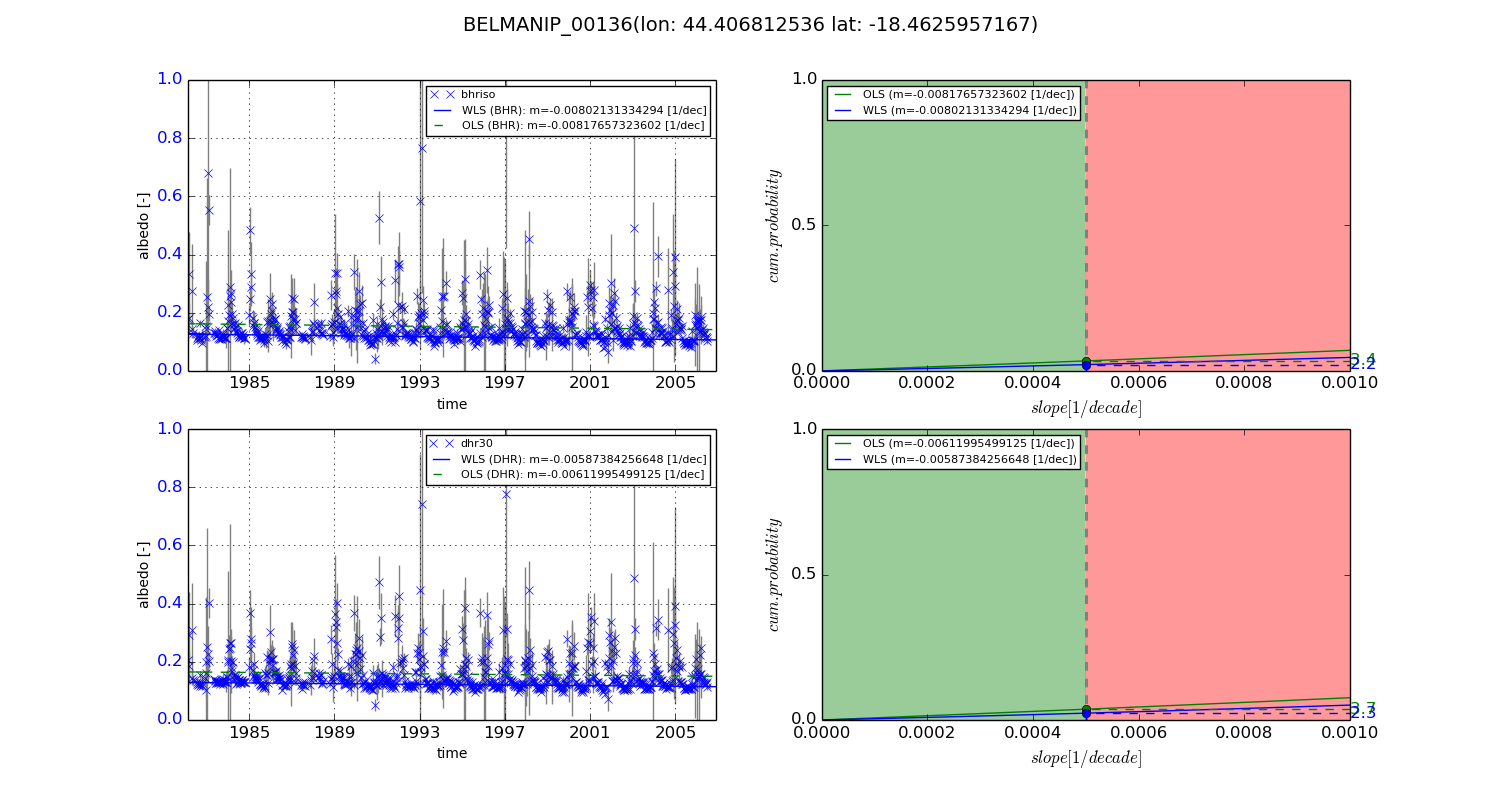
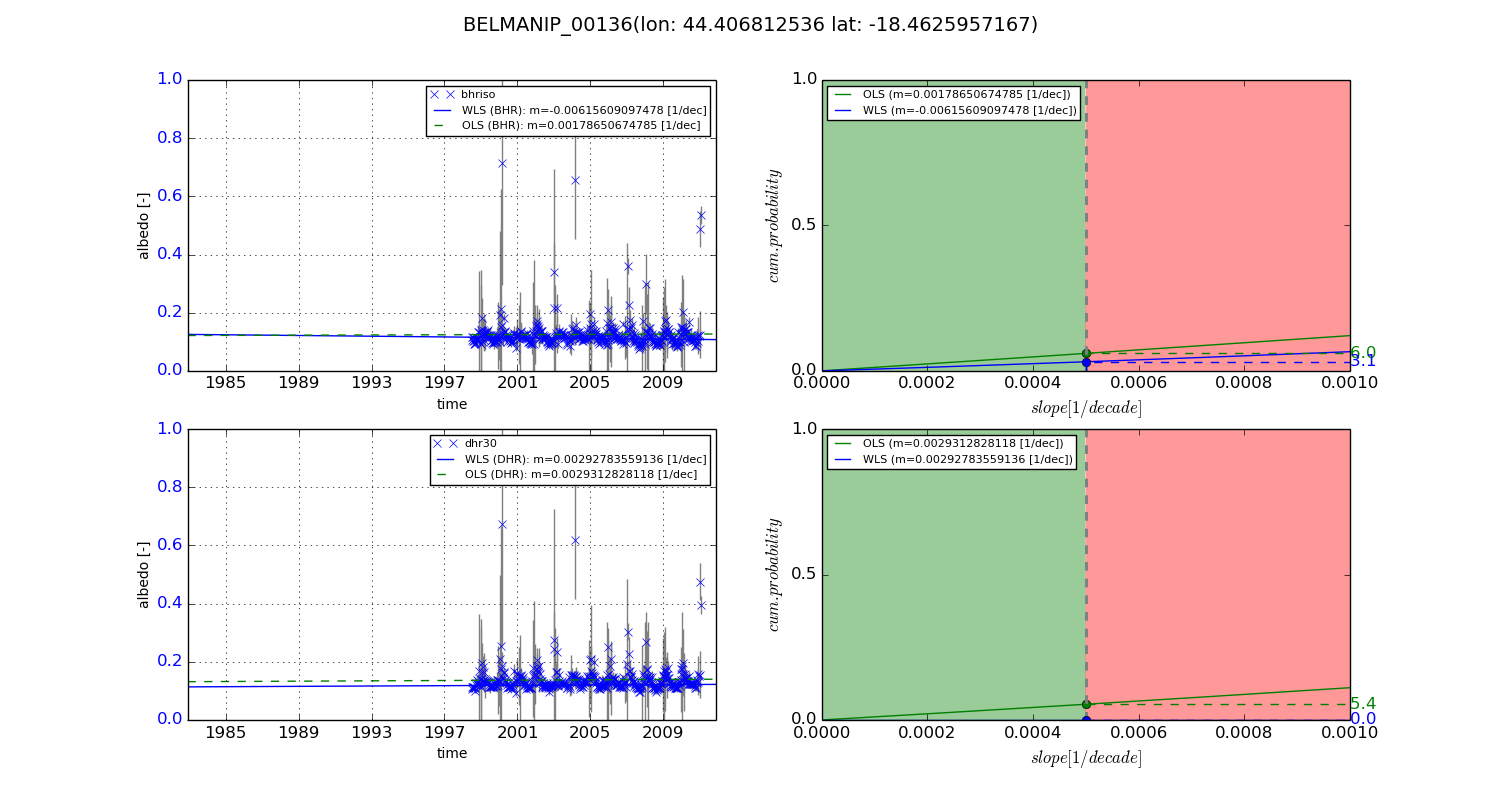
Temporal stability analysis

+000 deg (BHR)


BHR statistics

Temporal stability [1/decade]:


abs

rel


Weighted least square:

-0.00802131334294


Ordinary least square:

-0.00817657323602


Probabilities that GCOS criteria is met:

Weighted least square:

2.2 %

Ordinary least square:

3.4 %


DHR statistics

Temporal stability [1/decade]:


abs

rel


Weighted least square:

-0.00587384256648


Ordinary least square:

-0.00611995499125


Probabilities that GCOS criteria is met:

Weighted least square:

2.3 %

Ordinary least square:

3.7 %


+057/+063 deg (BHR)


BHR statistics

Temporal stability [1/decade]:


abs

rel


Weighted least square:

-0.00615609097478


Ordinary least square:

0.00178650674785


Probabilities that GCOS criteria is met:

Weighted least square:

3.1 %

Ordinary least square:

6.0 %


DHR statistics

Temporal stability [1/decade]:


abs

rel


Weighted least square:

0.00292783559136


Ordinary least square:

0.0029312828118


Probabilities that GCOS criteria is met:

Weighted least square:

0.0 %

Ordinary least square:

5.4 %


Temporal anomaly analyis

The variance of the temporal anomalies provides an additional measure about the stability of the signal AFTER removal of the mean seasonal cylce.
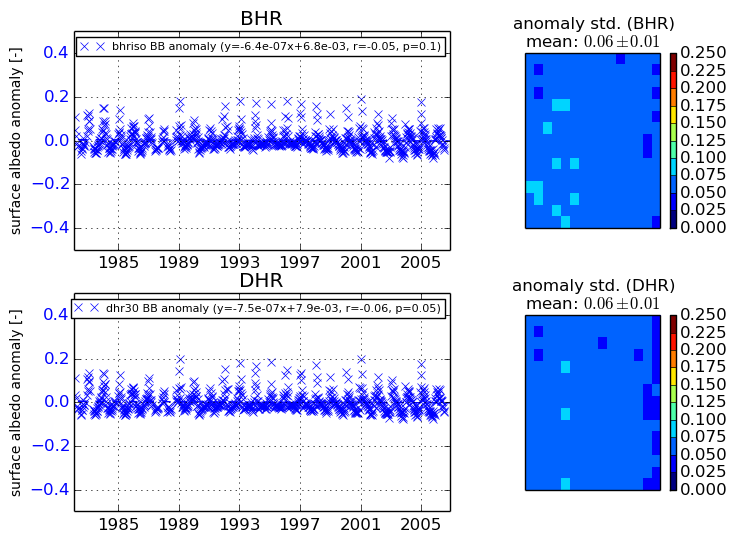
+000 deg


+057/+063 deg