BELMANIP_00138


Location

lon / lat [deg]: 46.5038 / -17.5573

Source network: BELMANIP


Geostationary surface albedo (GSA) data


“+000”


“+057/+063”


Landcover information (based on ESA CCI landcover data)


Landcover fractions @ 2km distance


Landcover fractions @ 20 km distance


Legend


Distance to open water bodies [km]:

29.64

Distance to urban areas [km]:

43.68


Radius: 1 km

Number of landcover classes:

1

Dominant landcover type:

130: grassland

Fraction of dominant landcover type [%]:

100.0


Radius: 2 km

Number of landcover classes:

1

Dominant landcover type:

130: grassland

Fraction of dominant landcover type [%]:

100.0


Radius: 5 km

Number of landcover classes:

2

Dominant landcover type:

130: grassland

Fraction of dominant landcover type [%]:

98.0


Radius: 10 km

Number of landcover classes:

4

Dominant landcover type:

130: grassland

Fraction of dominant landcover type [%]:

91.0


Radius: 20 km

Number of landcover classes:

4

Dominant landcover type:

130: grassland

Fraction of dominant landcover type [%]:

89.0


Disturbances


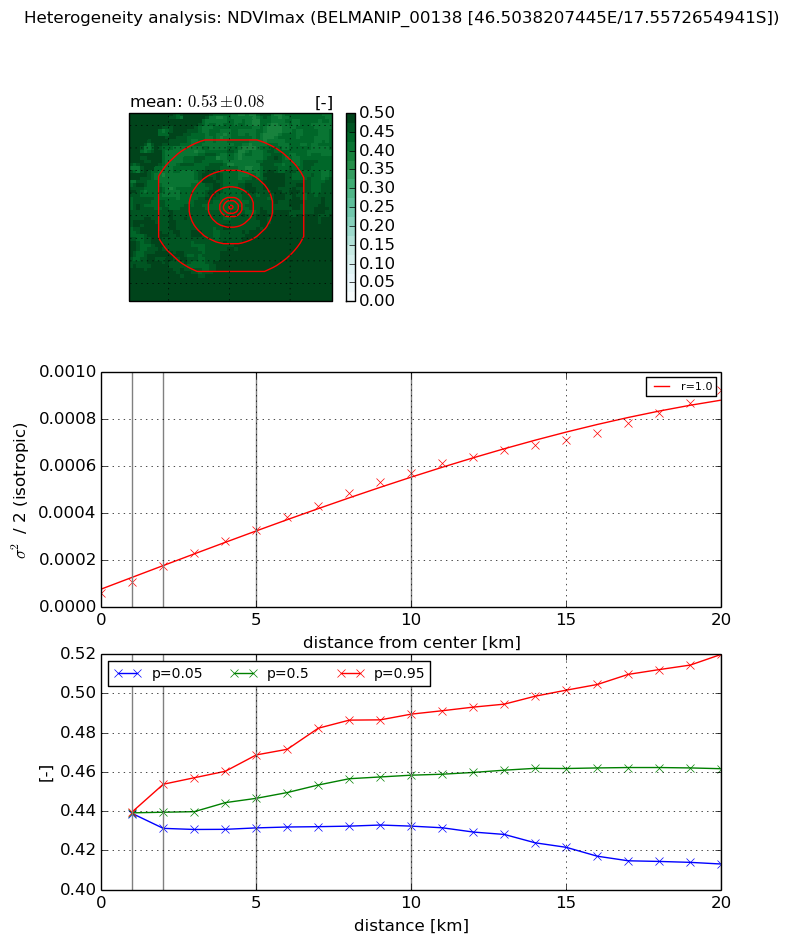
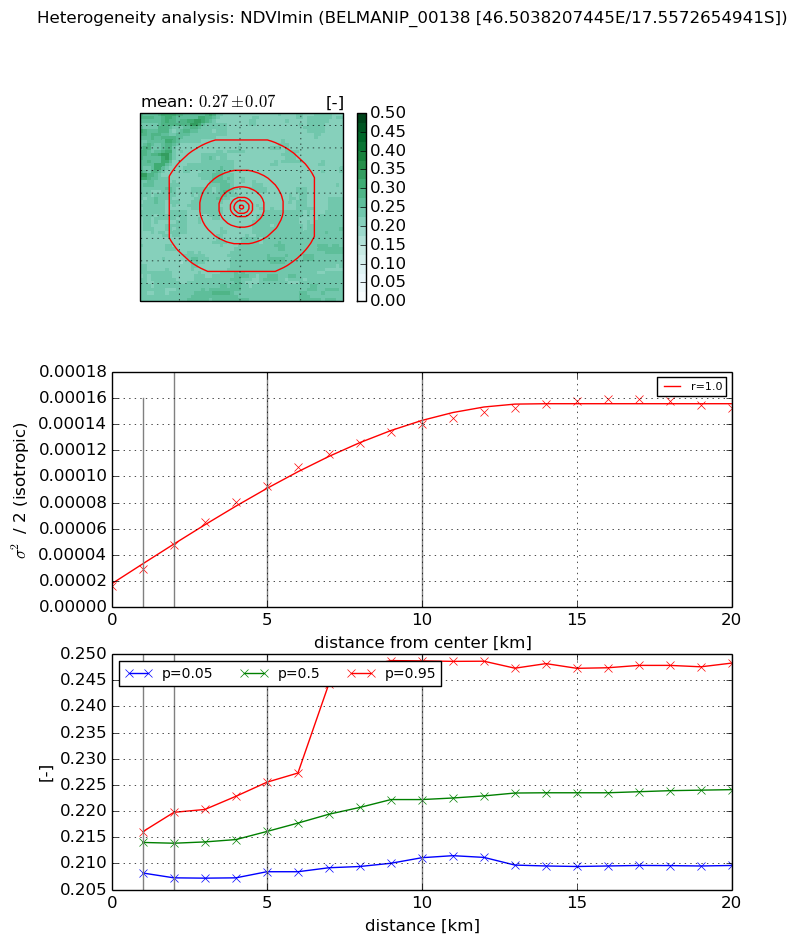
Heterogeneity analysis

The heterogeneity analysis provides information about the spatial and temporal heterogeneity of the site.

Topography


Roman et al. (2009) index


St

3.6579332556

Rcv

-0.00974291851277

Rse

0.0

Rst

-0.0930591146033

Rsv

0.717333215498


Height range @ 1km [m]

104

Height range @ 2km [m]

149

Height range @ 5km [m]

172

Height range @ 10km [m]

-999

Height range @ 20km [m]

-999


Variance slope @ 1 km

1058

Variance slope @ 2 km

1005

Variance slope @ 5 km

691

Variance slope @ 10 km

-999

Variance slope @ 20 km

-999


NDVI (max. NDVI composite)


Roman et al. (2009) index


St

3.8845421896

Rcv

0.154077653009

Rse

0.0

Rst

-0.0337035632454

Rsv

0.584510563206


NDVI range @ 1km [-]

0.0

NDVI range @ 2km [-]

0.02

NDVI range @ 5km [-]

0.04

NDVI range @ 10km [-]

0.06

NDVI range @ 20km [-]

0.11


Variance slope @ 1 km

4.52652095469e-05

Variance slope @ 2 km

5.61078556608e-05

Variance slope @ 5 km

5.45571973814e-05

Variance slope @ 10 km

5.17309742759e-05

Variance slope @ 20 km

4.0995219734e-05


NDVI (min. NDVI composite)I


Roman et al. (2009) index


St

3.79235982988

Rcv

0.246042880134

Rse

0.0

Rst

0.258457512147

Rsv

0.286563782686


NDVI range @ 1km [-]

0.01

NDVI range @ 2km [-]

0.01

NDVI range @ 5km [-]

0.02

NDVI range @ 10km [-]

0.04

NDVI range @ 20km [-]

0.04


NDVI slope @ 1 km

1.24420149836e-05

NDVI slope @ 2 km

1.56797679121e-05

NDVI slope @ 5 km

1.58114053571e-05

NDVI slope @ 10 km

1.27179743859e-05

NDVI slope @ 20 km

6.73653909035e-06


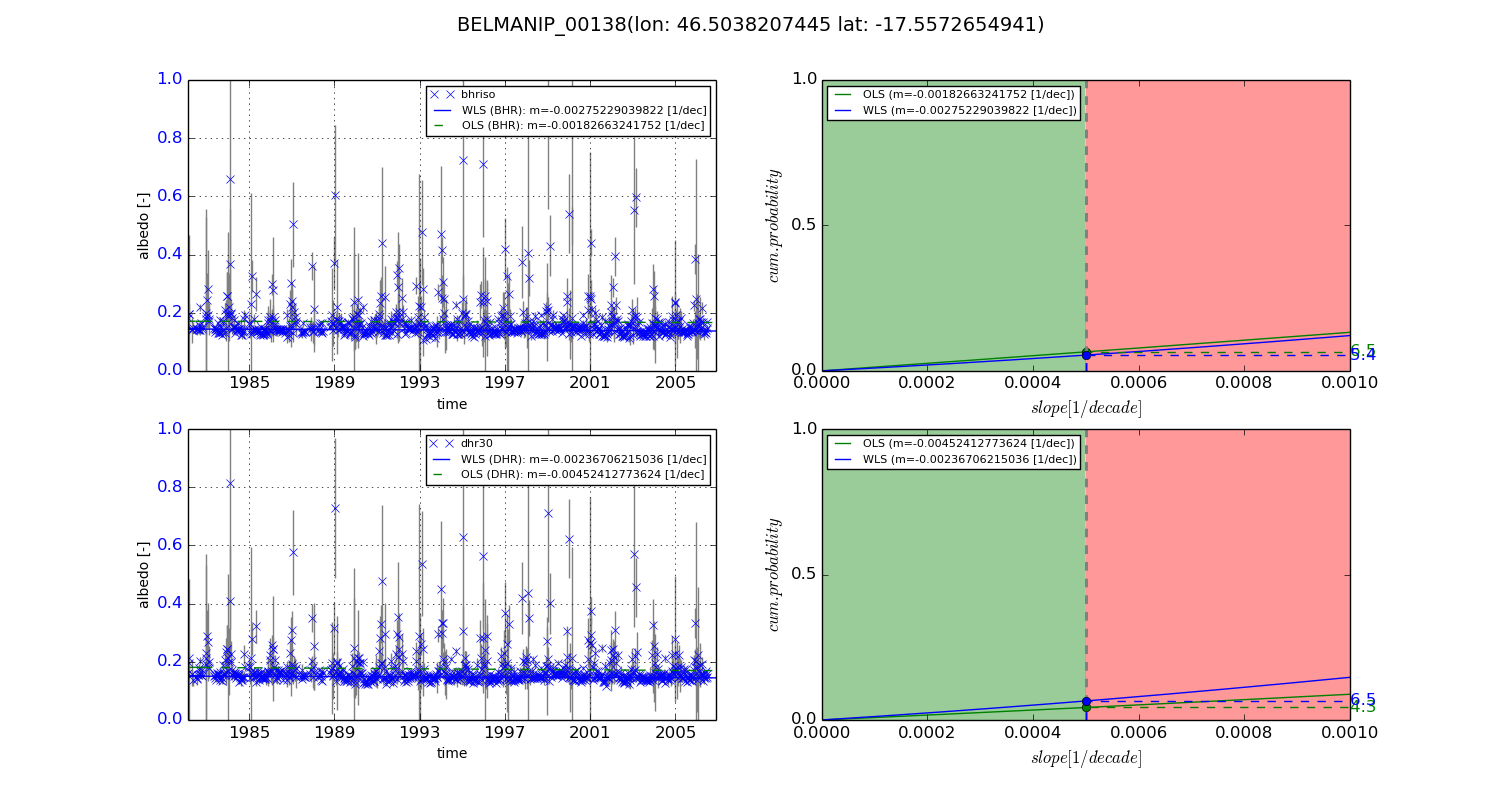
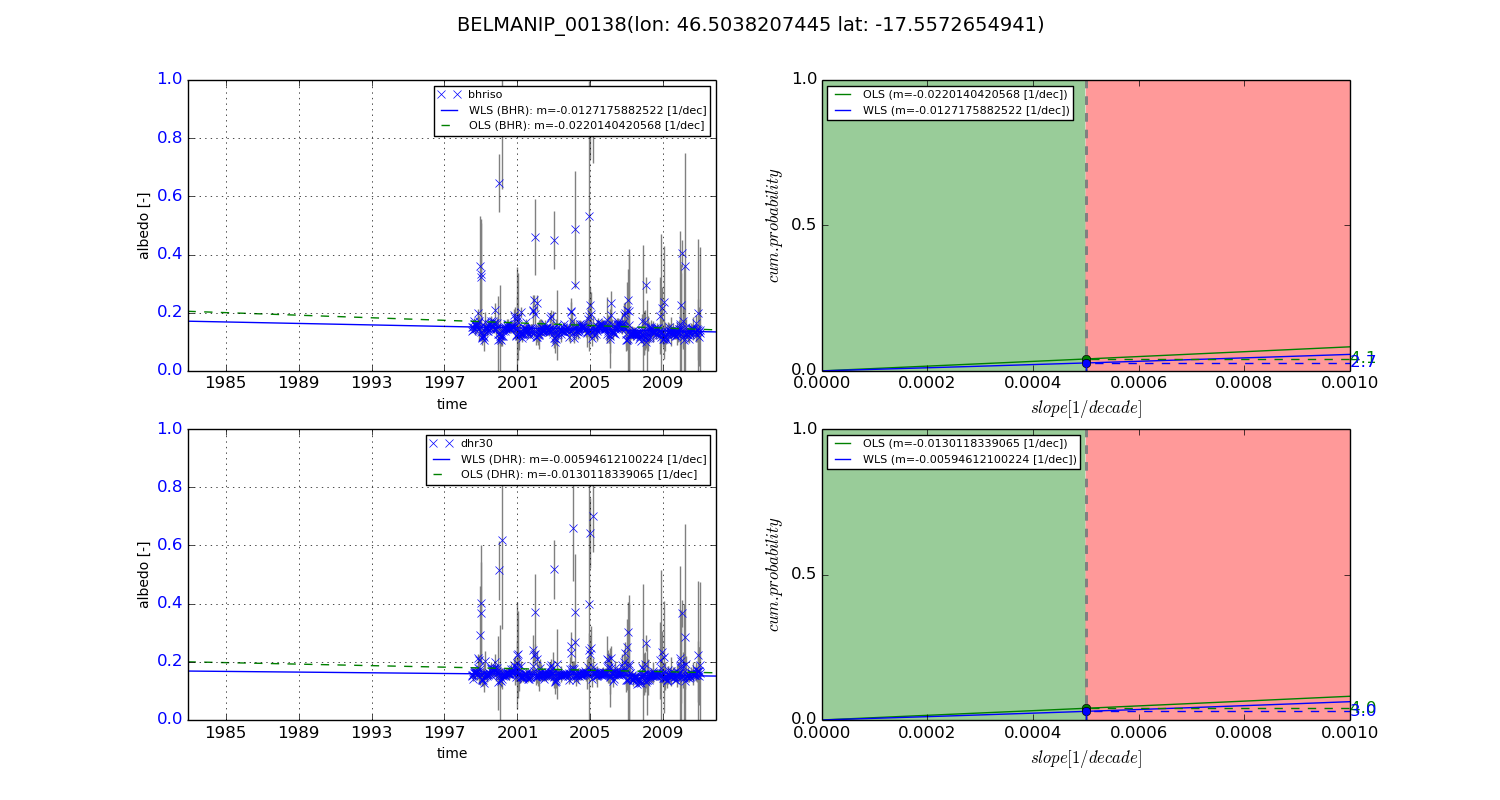
Temporal stability analysis

+000 deg (BHR)


BHR statistics

Temporal stability [1/decade]:


abs

rel


Weighted least square:

-0.00275229039822


Ordinary least square:

-0.00182663241752


Probabilities that GCOS criteria is met:

Weighted least square:

5.4 %

Ordinary least square:

6.5 %


DHR statistics

Temporal stability [1/decade]:


abs

rel


Weighted least square:

-0.00236706215036


Ordinary least square:

-0.00452412773624


Probabilities that GCOS criteria is met:

Weighted least square:

6.5 %

Ordinary least square:

4.3 %


+057/+063 deg (BHR)


BHR statistics

Temporal stability [1/decade]:


abs

rel


Weighted least square:

-0.0127175882522


Ordinary least square:

-0.0220140420568


Probabilities that GCOS criteria is met:

Weighted least square:

2.7 %

Ordinary least square:

4.1 %


DHR statistics

Temporal stability [1/decade]:


abs

rel


Weighted least square:

-0.00594612100224


Ordinary least square:

-0.0130118339065


Probabilities that GCOS criteria is met:

Weighted least square:

3.0 %

Ordinary least square:

4.0 %


Temporal anomaly analyis

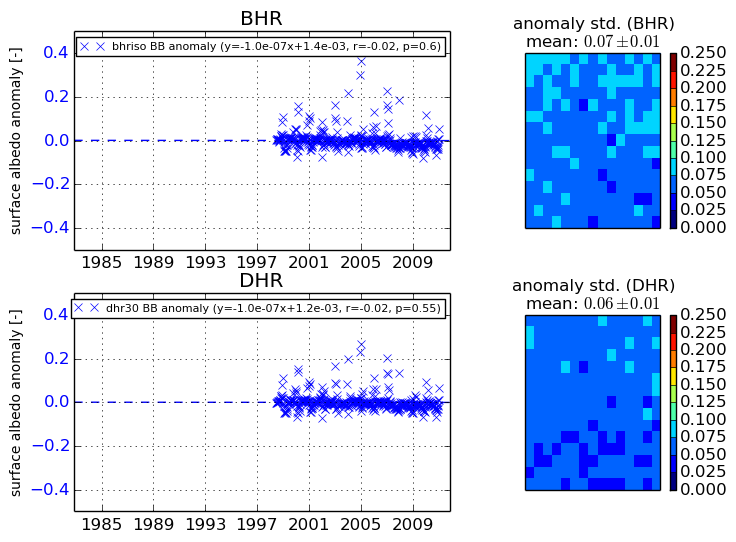
The variance of the temporal anomalies provides an additional measure about the stability of the signal AFTER removal of the mean seasonal cylce.
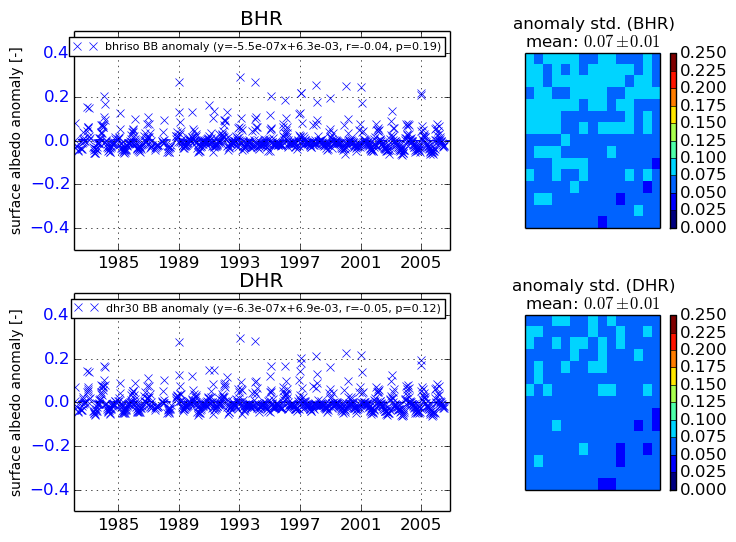
+000 deg


+057/+063 deg