BELMANIP_00144


Location

lon / lat [deg]: 19.0008 / -9.5188

Source network: BELMANIP


Geostationary surface albedo (GSA) data


“+000”


“+057/+063”


Landcover information (based on ESA CCI landcover data)


Landcover fractions @ 2km distance


Landcover fractions @ 20 km distance


Legend


Distance to open water bodies [km]:

58.99

Distance to urban areas [km]:

32.56


Radius: 1 km

Number of landcover classes:

1

Dominant landcover type:

61: Tree cover, broadleaved, decidous (closed > 40%)

Fraction of dominant landcover type [%]:

100.0


Radius: 2 km

Number of landcover classes:

2

Dominant landcover type:

61: Tree cover, broadleaved, decidous (closed > 40%)

Fraction of dominant landcover type [%]:

97.0


Radius: 5 km

Number of landcover classes:

2

Dominant landcover type:

61: Tree cover, broadleaved, decidous (closed > 40%)

Fraction of dominant landcover type [%]:

84.0


Radius: 10 km

Number of landcover classes:

3

Dominant landcover type:

61: Tree cover, broadleaved, decidous (closed > 40%)

Fraction of dominant landcover type [%]:

65.0


Radius: 20 km

Number of landcover classes:

3

Dominant landcover type:

61: Tree cover, broadleaved, decidous (closed > 40%)

Fraction of dominant landcover type [%]:

48.0


Disturbances


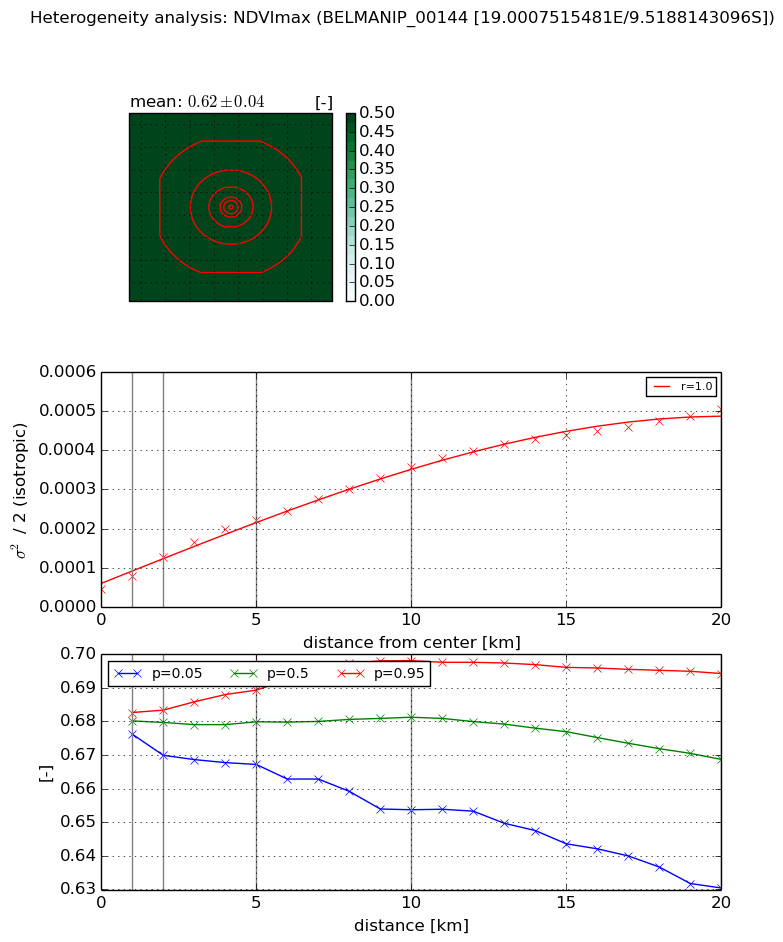
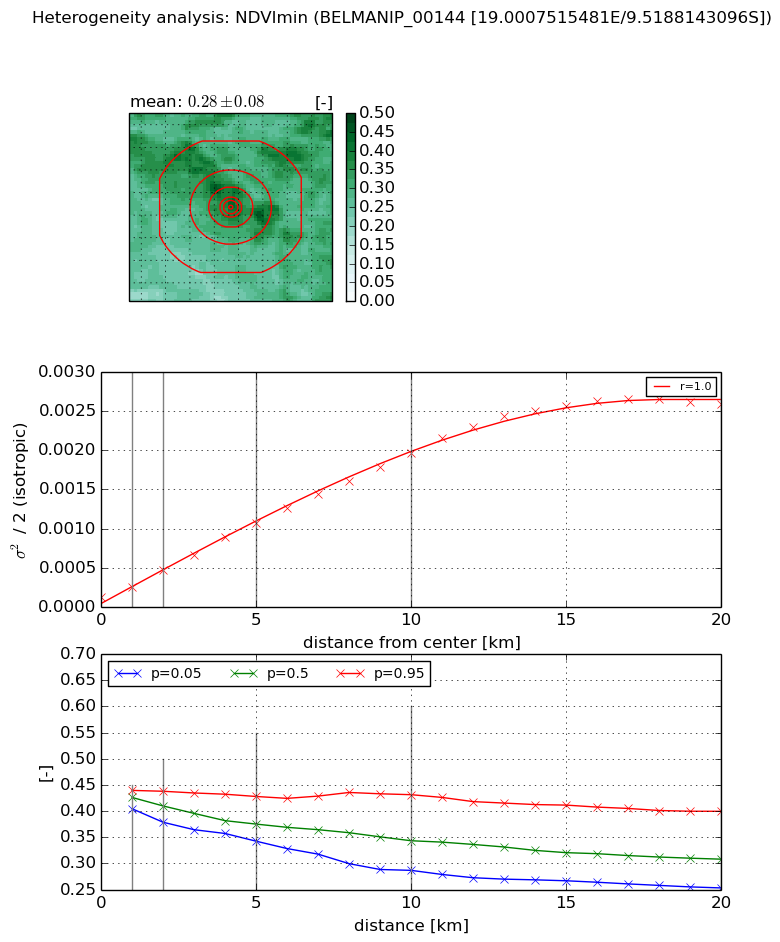
Heterogeneity analysis

The heterogeneity analysis provides information about the spatial and temporal heterogeneity of the site.

Topography


Roman et al. (2009) index


St

0.642947907543

Rcv

1.29378920823

Rse

0.0

Rst

3.39902864815e-05

Rsv

3.37218467678


Height range @ 1km [m]

3

Height range @ 2km [m]

10

Height range @ 5km [m]

47

Height range @ 10km [m]

-999

Height range @ 20km [m]

-999


Variance slope @ 1 km

14

Variance slope @ 2 km

27

Variance slope @ 5 km

48

Variance slope @ 10 km

-999

Variance slope @ 20 km

-999


NDVI (max. NDVI composite)


Roman et al. (2009) index


St

1.7466780366

Rcv

0.406519647602

Rse

0.0

Rst

-0.311026669926

Rsv

-0.999999754006


NDVI range @ 1km [-]

0.01

NDVI range @ 2km [-]

0.01

NDVI range @ 5km [-]

0.02

NDVI range @ 10km [-]

0.04

NDVI range @ 20km [-]

0.06


Variance slope @ 1 km

3.31128253597e-05

Variance slope @ 2 km

4.14141777643e-05

Variance slope @ 5 km

3.65396911728e-05

Variance slope @ 10 km

3.03727803025e-05

Variance slope @ 20 km

2.22071229035e-05


NDVI (min. NDVI composite)I


Roman et al. (2009) index


St

7.45082120223

Rcv

0.137413898018

Rse

0.0

Rst

-0.0299167988003

Rsv

0.235309484523


NDVI range @ 1km [-]

0.04

NDVI range @ 2km [-]

0.06

NDVI range @ 5km [-]

0.09

NDVI range @ 10km [-]

0.14

NDVI range @ 20km [-]

0.15


NDVI slope @ 1 km

0.000125378815499

NDVI slope @ 2 km

0.000170605644995

NDVI slope @ 5 km

0.000194478036658

NDVI slope @ 10 km

0.000187686232132

NDVI slope @ 20 km

0.0001358206882


Temporal stability analysis

+000 deg (BHR)


BHR statistics

Temporal stability [1/decade]:


abs

rel


Weighted least square:

-0.00674430625584


Ordinary least square:

-0.0013248177787


Probabilities that GCOS criteria is met:

Weighted least square:

2.6 %

Ordinary least square:

6.7 %


DHR statistics

Temporal stability [1/decade]:


abs

rel


Weighted least square:

-0.0072444303675


Ordinary least square:

-0.00346247004859


Probabilities that GCOS criteria is met:

Weighted least square:

2.3 %

Ordinary least square:

5.0 %


+057/+063 deg (BHR)


BHR statistics

Temporal stability [1/decade]:


abs

rel


Weighted least square:

0.00124070124165


Ordinary least square:

-0.0405399764704


Probabilities that GCOS criteria is met:

Weighted least square:

9.8 %

Ordinary least square:

4.4 %


DHR statistics

Temporal stability [1/decade]:


abs

rel


Weighted least square:

0.00458800885076


Ordinary least square:

-0.0427657513024


Probabilities that GCOS criteria is met:

Weighted least square:

0.0 %

Ordinary least square:

4.4 %


Temporal anomaly analyis

The variance of the temporal anomalies provides an additional measure about the stability of the signal AFTER removal of the mean seasonal cylce.
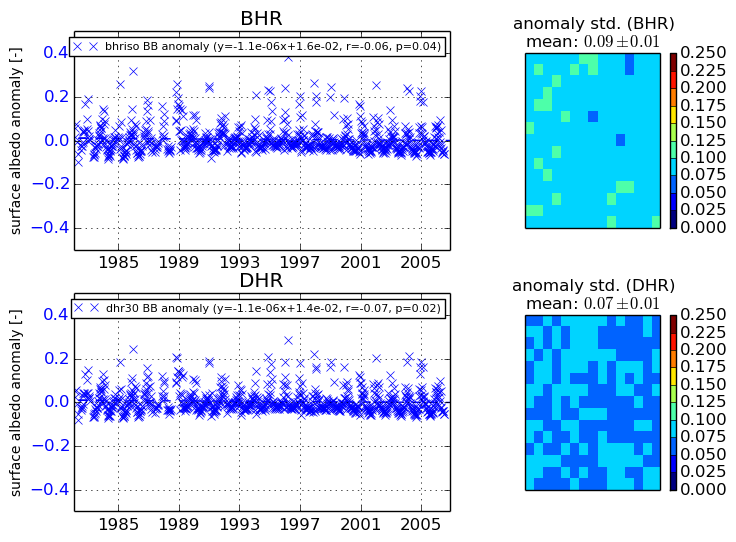
+000 deg


+057/+063 deg