BELMANIP_00145


Location

lon / lat [deg]: 30.373 / -6.0987

Source network: BELMANIP


Geostationary surface albedo (GSA) data


“+000”


“+057/+063”


Landcover information (based on ESA CCI landcover data)


Landcover fractions @ 2km distance


Landcover fractions @ 20 km distance


Legend


Distance to open water bodies [km]:

46.5

Distance to urban areas [km]:

49.98


Radius: 1 km

Number of landcover classes:

4

Dominant landcover type:

60: Tree cover, broadleaved, decidous

Fraction of dominant landcover type [%]:

65.0


Radius: 2 km

Number of landcover classes:

4

Dominant landcover type:

60: Tree cover, broadleaved, decidous

Fraction of dominant landcover type [%]:

51.0


Radius: 5 km

Number of landcover classes:

5

Dominant landcover type:

62: Tree cover, broadleaved, decidous (open 15-40%)

Fraction of dominant landcover type [%]:

49.0


Radius: 10 km

Number of landcover classes:

6

Dominant landcover type:

62: Tree cover, broadleaved, decidous (open 15-40%)

Fraction of dominant landcover type [%]:

44.0


Radius: 20 km

Number of landcover classes:

6

Dominant landcover type:

62: Tree cover, broadleaved, decidous (open 15-40%)

Fraction of dominant landcover type [%]:

30.0


Disturbances


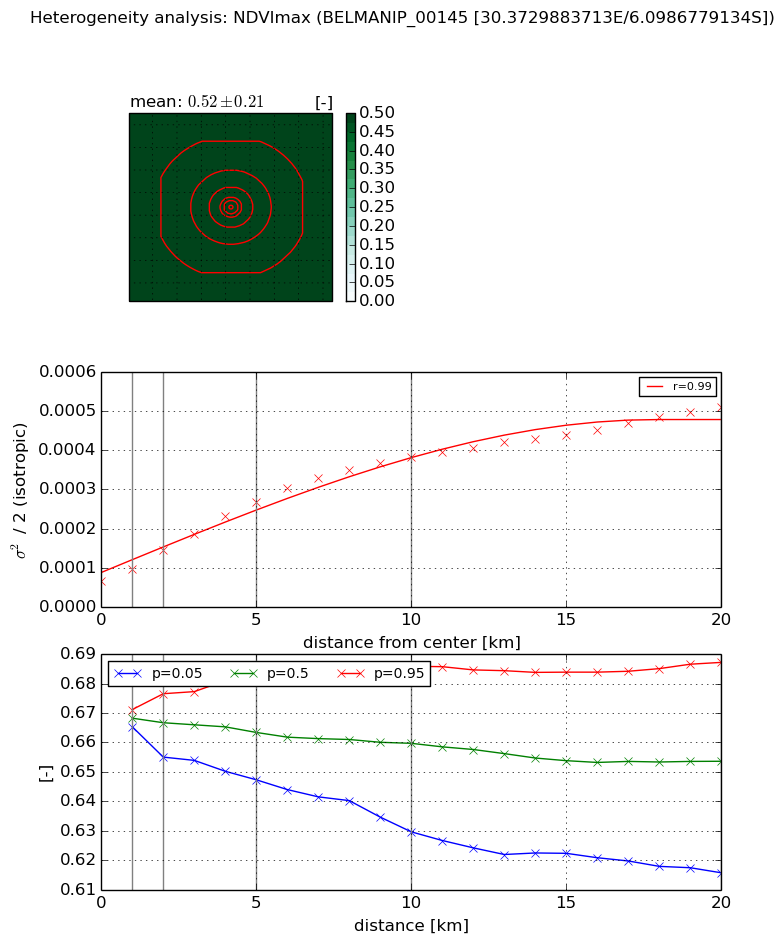
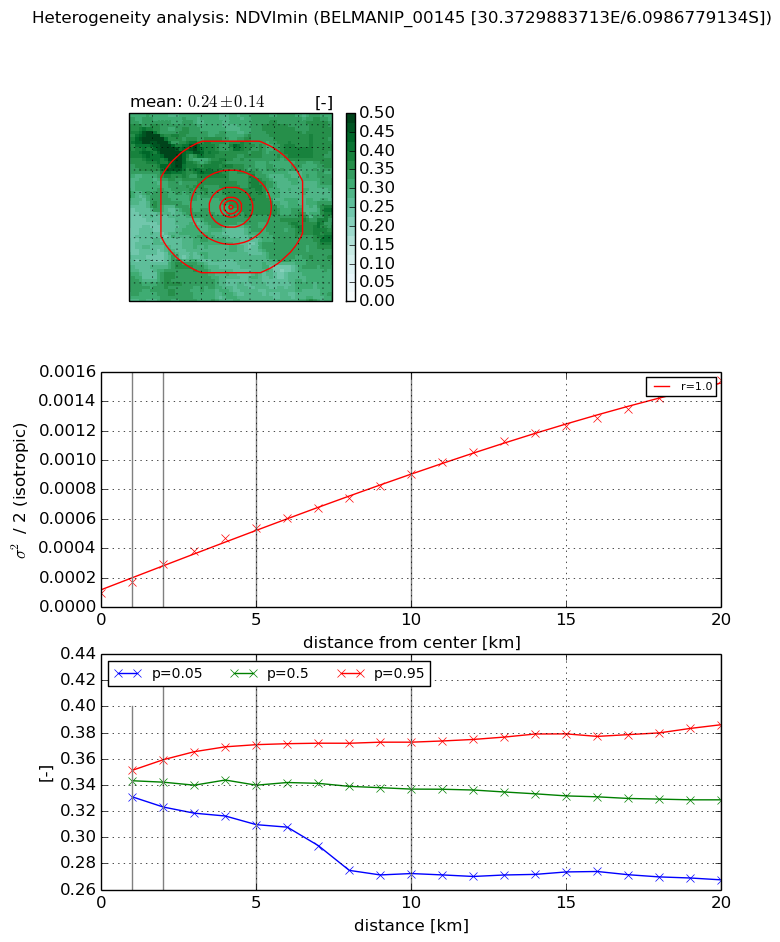
Heterogeneity analysis

The heterogeneity analysis provides information about the spatial and temporal heterogeneity of the site.

Topography


Roman et al. (2009) index


St

2.5621240443

Rcv

0.0829406886035

Rse

0.0

Rst

-0.0879916195804

Rsv

-0.999971187561


Height range @ 1km [m]

245

Height range @ 2km [m]

252

Height range @ 5km [m]

291

Height range @ 10km [m]

-999

Height range @ 20km [m]

-999


Variance slope @ 1 km

3017

Variance slope @ 2 km

2522

Variance slope @ 5 km

1735

Variance slope @ 10 km

-999

Variance slope @ 20 km

-999


NDVI (max. NDVI composite)


Roman et al. (2009) index


St

1.21322894991

Rcv

0.534205294019

Rse

0.0

Rst

-0.332421207492

Rsv

1.60611370157


NDVI range @ 1km [-]

0.01

NDVI range @ 2km [-]

0.02

NDVI range @ 5km [-]

0.04

NDVI range @ 10km [-]

0.06

NDVI range @ 20km [-]

0.07


Variance slope @ 1 km

3.24355988696e-05

Variance slope @ 2 km

4.05694266522e-05

Variance slope @ 5 km

4.17383146586e-05

Variance slope @ 10 km

3.29432344596e-05

Variance slope @ 20 km

2.04905435634e-05


NDVI (min. NDVI composite)I


Roman et al. (2009) index


St

2.76025978985

Rcv

0.175508608829

Rse

0.0

Rst

-0.0799866310056

Rsv

0.831358979841


NDVI range @ 1km [-]

0.02

NDVI range @ 2km [-]

0.04

NDVI range @ 5km [-]

0.06

NDVI range @ 10km [-]

0.1

NDVI range @ 20km [-]

0.12


NDVI slope @ 1 km

7.74326626475e-05

NDVI slope @ 2 km

9.87507813014e-05

NDVI slope @ 5 km

9.143784268e-05

NDVI slope @ 10 km

7.92370002626e-05

NDVI slope @ 20 km

7.12389062073e-05


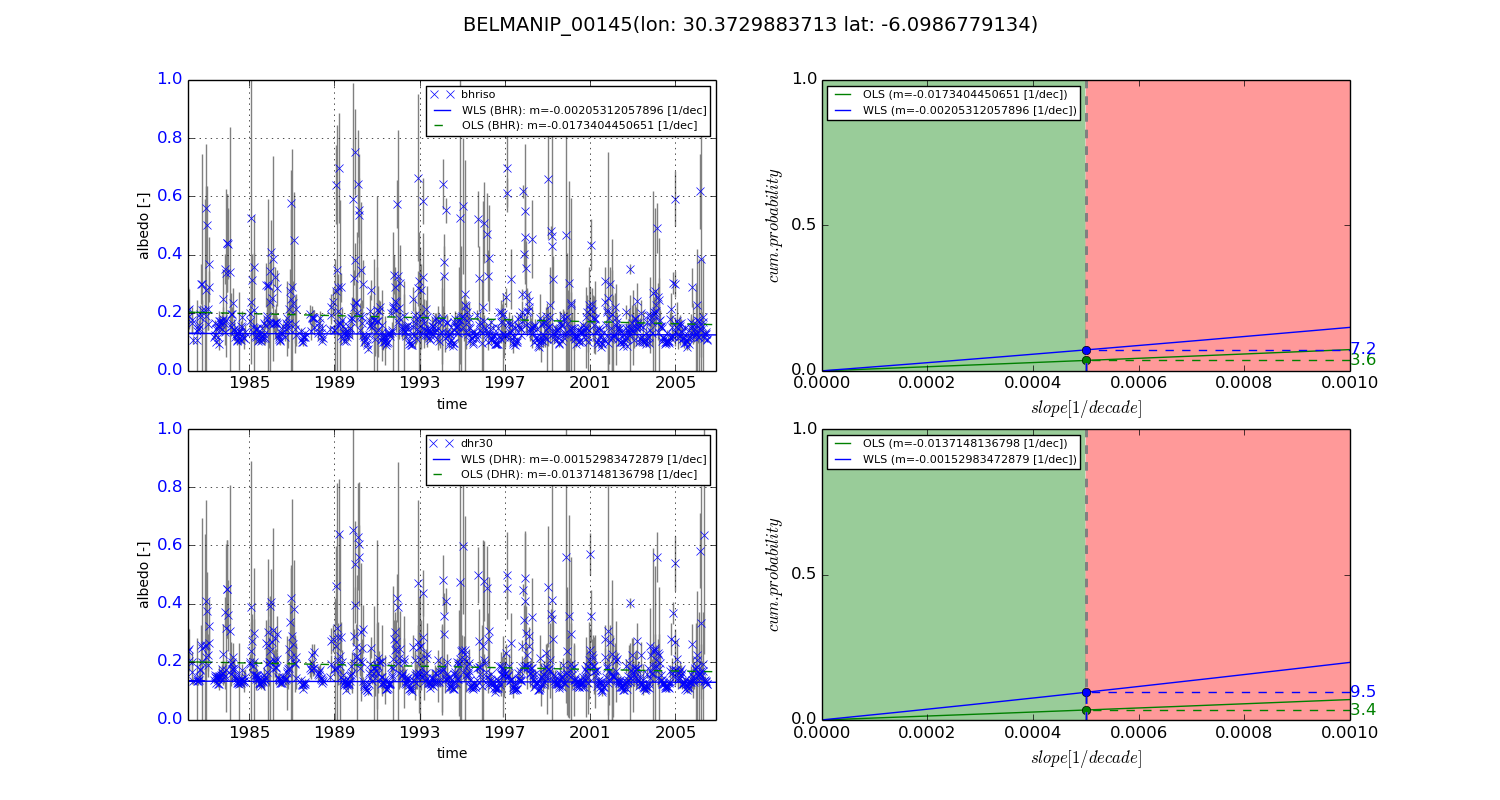
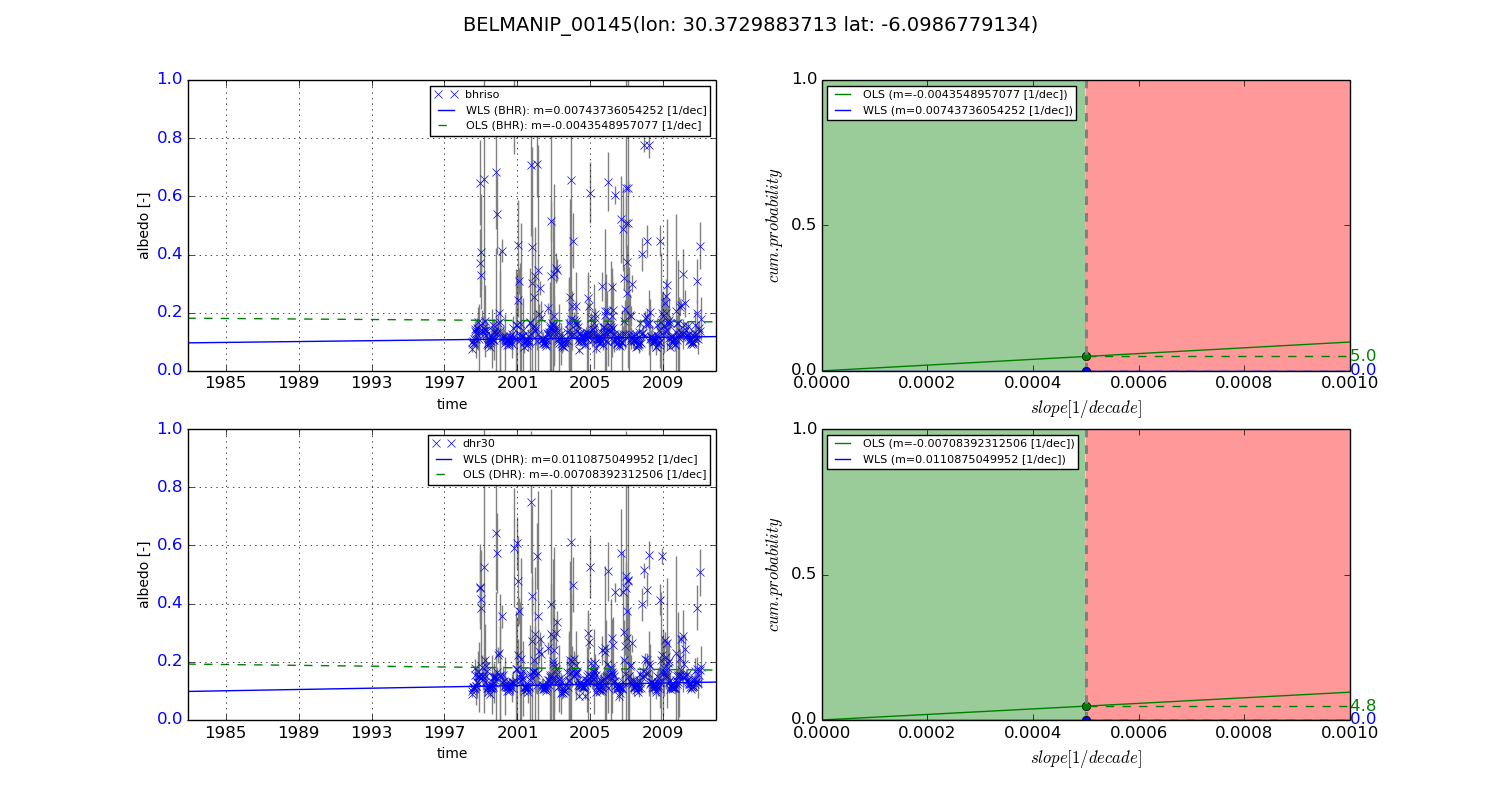
Temporal stability analysis

+000 deg (BHR)


BHR statistics

Temporal stability [1/decade]:


abs

rel


Weighted least square:

-0.00205312057896


Ordinary least square:

-0.0173404450651


Probabilities that GCOS criteria is met:

Weighted least square:

7.2 %

Ordinary least square:

3.6 %


DHR statistics

Temporal stability [1/decade]:


abs

rel


Weighted least square:

-0.00152983472879


Ordinary least square:

-0.0137148136798


Probabilities that GCOS criteria is met:

Weighted least square:

9.5 %

Ordinary least square:

3.4 %


+057/+063 deg (BHR)


BHR statistics

Temporal stability [1/decade]:


abs

rel


Weighted least square:

0.00743736054252


Ordinary least square:

-0.0043548957077


Probabilities that GCOS criteria is met:

Weighted least square:

0.0 %

Ordinary least square:

5.0 %


DHR statistics

Temporal stability [1/decade]:


abs

rel


Weighted least square:

0.0110875049952


Ordinary least square:

-0.00708392312506


Probabilities that GCOS criteria is met:

Weighted least square:

0.0 %

Ordinary least square:

4.8 %


Temporal anomaly analyis

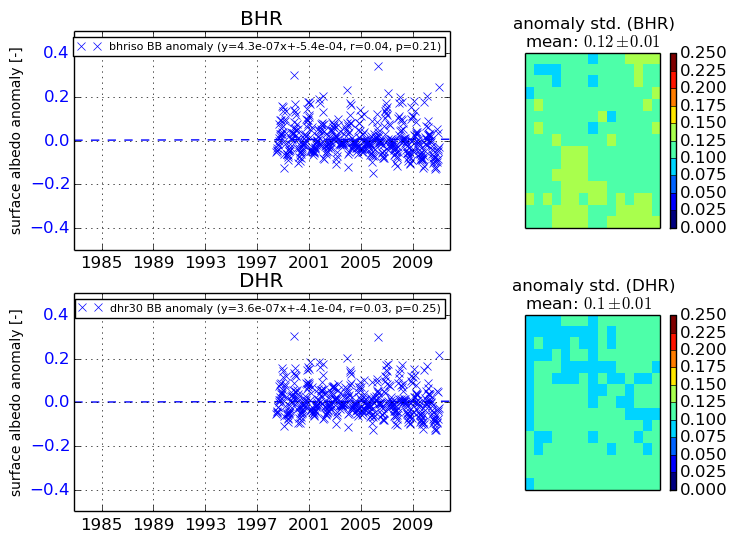
The variance of the temporal anomalies provides an additional measure about the stability of the signal AFTER removal of the mean seasonal cylce.
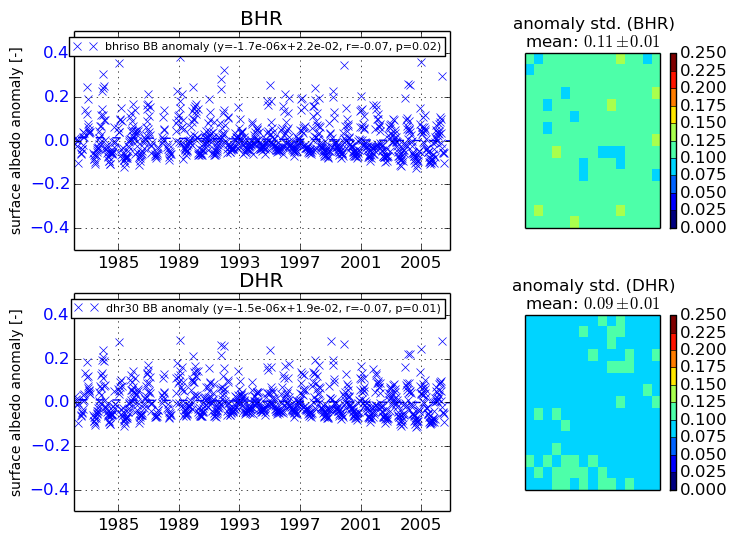
+000 deg


+057/+063 deg


By continuing to use this website, you are giving consent to analytic cookies being used. For more information on how EUMETSAT uses data and how you can disable this, please view this web page: Analytics Cookie Policy