BELMANIP_00147


Location

lon / lat [deg]: 30.2923 / -9.5691

Source network: BELMANIP


Geostationary surface albedo (GSA) data


“+000”


“+057/+063”


Landcover information (based on ESA CCI landcover data)


Landcover fractions @ 2km distance


Landcover fractions @ 20 km distance


Legend


Distance to open water bodies [km]:

21.89

Distance to urban areas [km]:

22.69


Radius: 1 km

Number of landcover classes:

1

Dominant landcover type:

10: cropland, rainfed

Fraction of dominant landcover type [%]:

100.0


Radius: 2 km

Number of landcover classes:

2

Dominant landcover type:

10: cropland, rainfed

Fraction of dominant landcover type [%]:

95.0


Radius: 5 km

Number of landcover classes:

2

Dominant landcover type:

10: cropland, rainfed

Fraction of dominant landcover type [%]:

84.0


Radius: 10 km

Number of landcover classes:

4

Dominant landcover type:

10: cropland, rainfed

Fraction of dominant landcover type [%]:

72.0


Radius: 20 km

Number of landcover classes:

4

Dominant landcover type:

10: cropland, rainfed

Fraction of dominant landcover type [%]:

54.0


Disturbances


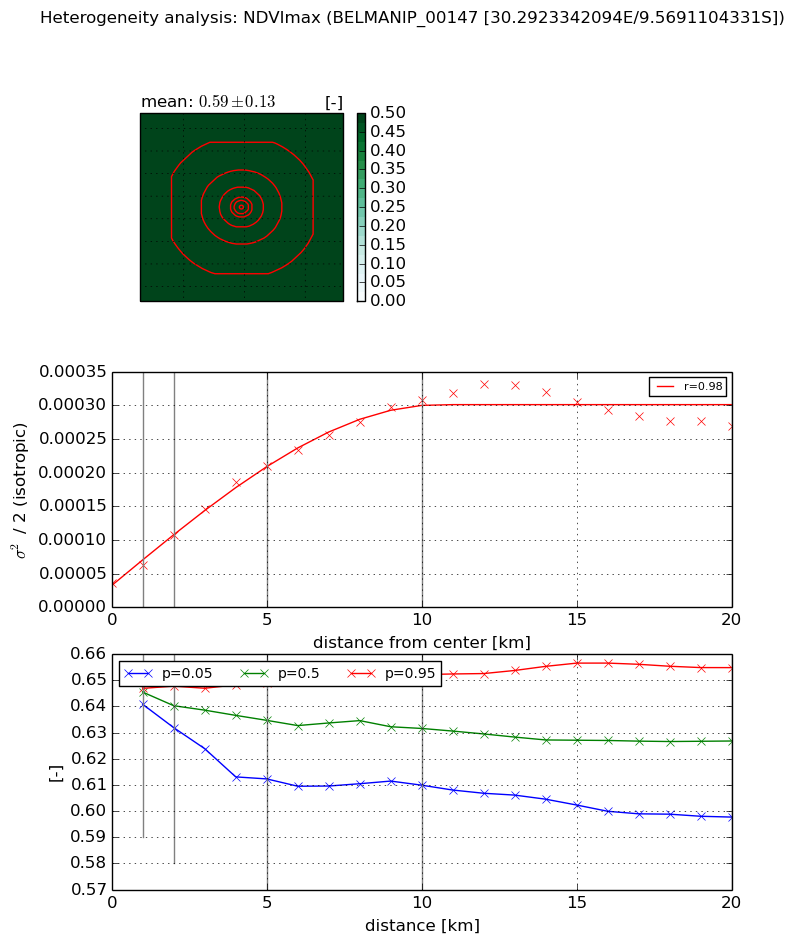
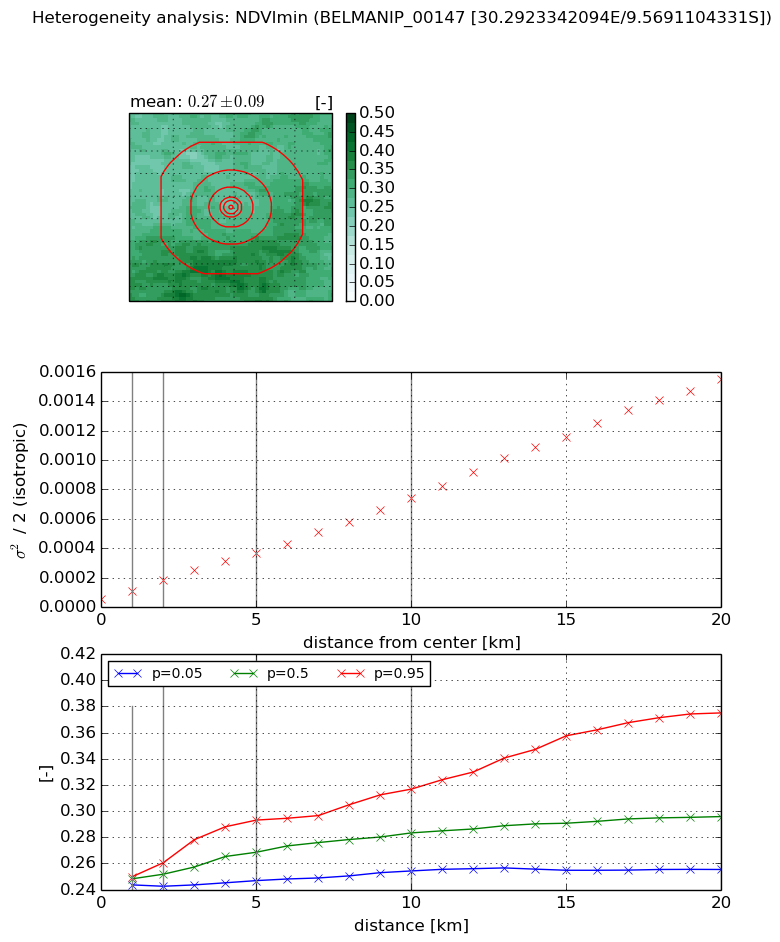
Heterogeneity analysis

The heterogeneity analysis provides information about the spatial and temporal heterogeneity of the site.

Topography


Roman et al. (2009) index


St

5.49386260792

Rcv

0.422902478327

Rse

0.0

Rst

-1.02293544979e-06

Rsv

-0.123160391139


Height range @ 1km [m]

31

Height range @ 2km [m]

65

Height range @ 5km [m]

130

Height range @ 10km [m]

-999

Height range @ 20km [m]

-999


Variance slope @ 1 km

223

Variance slope @ 2 km

334

Variance slope @ 5 km

482

Variance slope @ 10 km

-999

Variance slope @ 20 km

-999


NDVI (max. NDVI composite)


Roman et al. (2009) index


St

nan

Rcv

nan

Rse

nan

Rst

nan

Rsv

nan


NDVI range @ 1km [-]

0.01

NDVI range @ 2km [-]

0.02

NDVI range @ 5km [-]

0.04

NDVI range @ 10km [-]

0.04

NDVI range @ 20km [-]

0.06


Variance slope @ 1 km

2.71735065501e-05

Variance slope @ 2 km

3.58729803718e-05

Variance slope @ 5 km

3.65330600579e-05

Variance slope @ 10 km

2.79311749884e-05

Variance slope @ 20 km

1.09159420069e-05


NDVI (min. NDVI composite)I


Roman et al. (2009) index


St

4.39074414998

Rcv

0.194931995598

Rse

0.0

Rst

-0.112054379694

Rsv

0.376269104309


NDVI range @ 1km [-]

0.01

NDVI range @ 2km [-]

0.02

NDVI range @ 5km [-]

0.05

NDVI range @ 10km [-]

0.06

NDVI range @ 20km [-]

0.12


NDVI slope @ 1 km

4.86743866322e-05

NDVI slope @ 2 km

6.35335012746e-05

NDVI slope @ 5 km

6.3981796469e-05

NDVI slope @ 10 km

6.76466594206e-05

NDVI slope @ 20 km

7.6951020877e-05


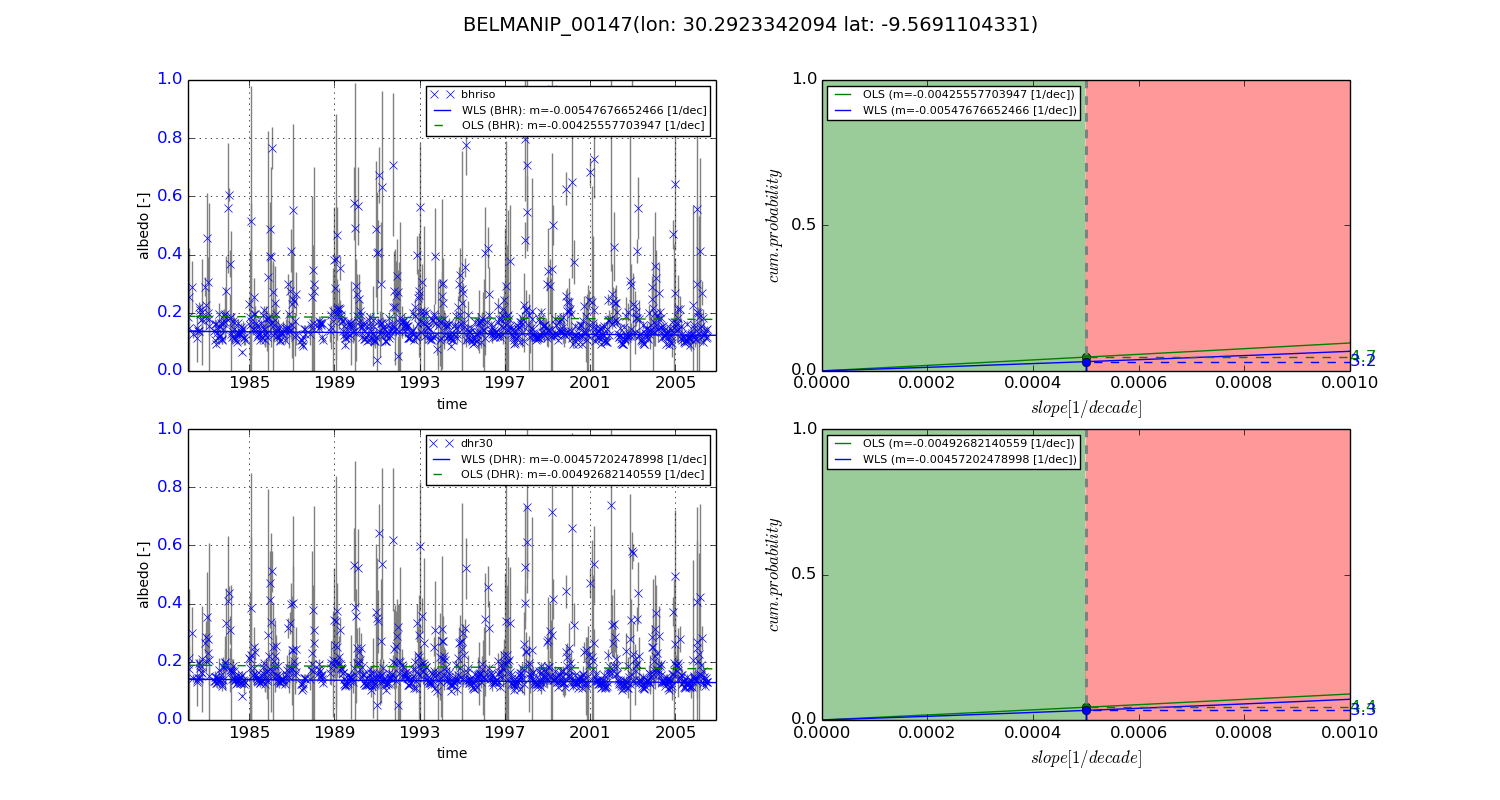
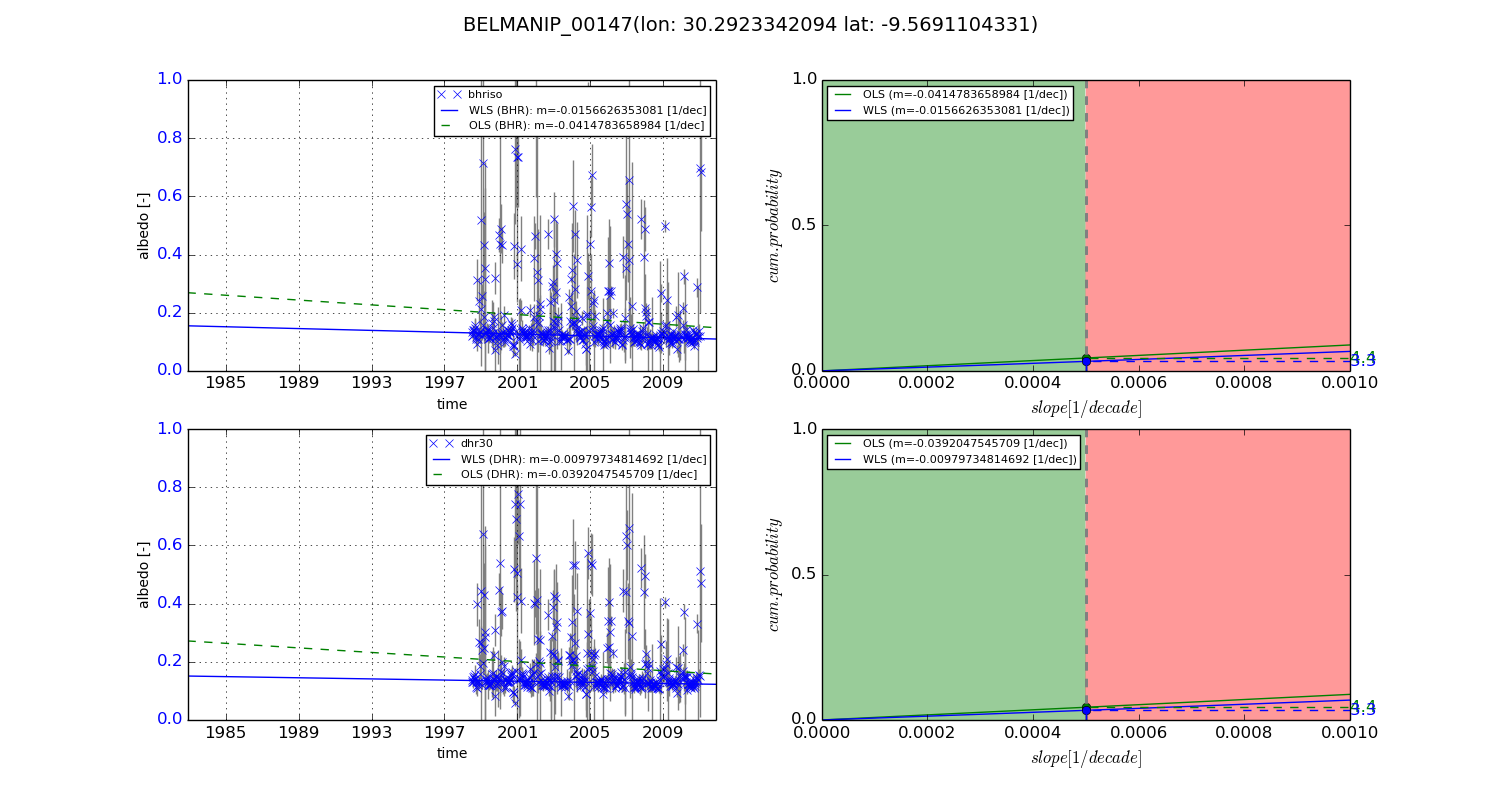
Temporal stability analysis

+000 deg (BHR)


BHR statistics

Temporal stability [1/decade]:


abs

rel


Weighted least square:

-0.00547676652466


Ordinary least square:

-0.00425557703947


Probabilities that GCOS criteria is met:

Weighted least square:

3.2 %

Ordinary least square:

4.7 %


DHR statistics

Temporal stability [1/decade]:


abs

rel


Weighted least square:

-0.00457202478998


Ordinary least square:

-0.00492682140559


Probabilities that GCOS criteria is met:

Weighted least square:

3.3 %

Ordinary least square:

4.4 %


+057/+063 deg (BHR)


BHR statistics

Temporal stability [1/decade]:


abs

rel


Weighted least square:

-0.0156626353081


Ordinary least square:

-0.0414783658984


Probabilities that GCOS criteria is met:

Weighted least square:

3.3 %

Ordinary least square:

4.4 %


DHR statistics

Temporal stability [1/decade]:


abs

rel


Weighted least square:

-0.00979734814692


Ordinary least square:

-0.0392047545709


Probabilities that GCOS criteria is met:

Weighted least square:

3.3 %

Ordinary least square:

4.4 %


Temporal anomaly analyis

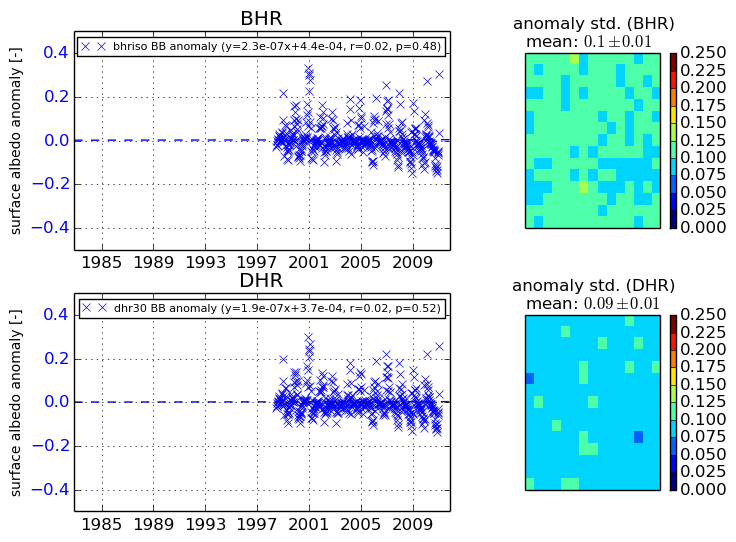
The variance of the temporal anomalies provides an additional measure about the stability of the signal AFTER removal of the mean seasonal cylce.
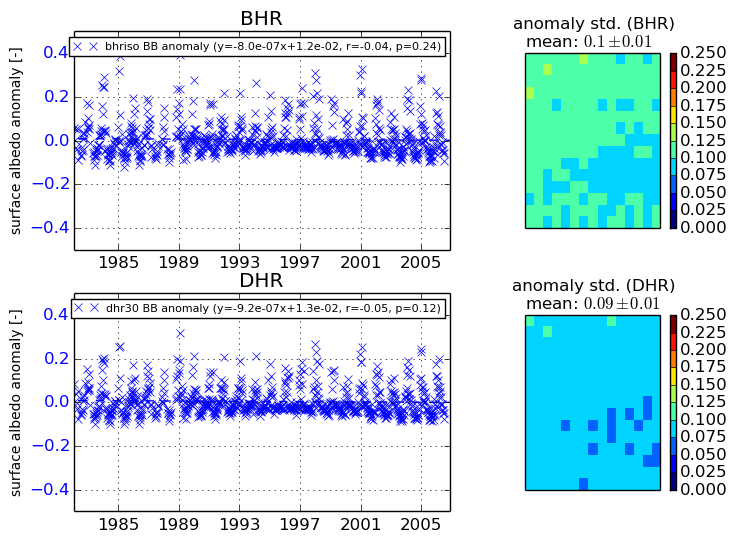
+000 deg


+057/+063 deg