BELMANIP_00149


Location

lon / lat [deg]: 27.2795 / -9.1964

Source network: BELMANIP


Geostationary surface albedo (GSA) data


“+000”


“+057/+063”


Landcover information (based on ESA CCI landcover data)


Landcover fractions @ 2km distance


Landcover fractions @ 20 km distance


Legend


Distance to open water bodies [km]:

21.26

Distance to urban areas [km]:

6.59


Radius: 1 km

Number of landcover classes:

3

Dominant landcover type:

62: Tree cover, broadleaved, decidous (open 15-40%)

Fraction of dominant landcover type [%]:

85.0


Radius: 2 km

Number of landcover classes:

4

Dominant landcover type:

62: Tree cover, broadleaved, decidous (open 15-40%)

Fraction of dominant landcover type [%]:

76.0


Radius: 5 km

Number of landcover classes:

4

Dominant landcover type:

62: Tree cover, broadleaved, decidous (open 15-40%)

Fraction of dominant landcover type [%]:

59.0


Radius: 10 km

Number of landcover classes:

5

Dominant landcover type:

62: Tree cover, broadleaved, decidous (open 15-40%)

Fraction of dominant landcover type [%]:

48.0


Radius: 20 km

Number of landcover classes:

5

Dominant landcover type:

62: Tree cover, broadleaved, decidous (open 15-40%)

Fraction of dominant landcover type [%]:

48.0


Disturbances


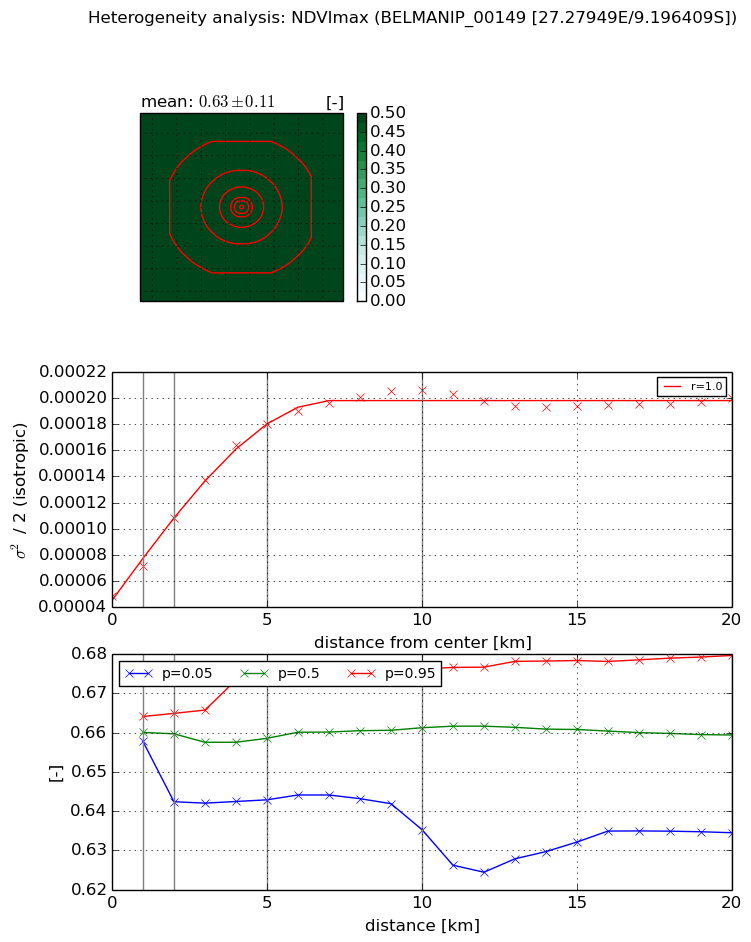
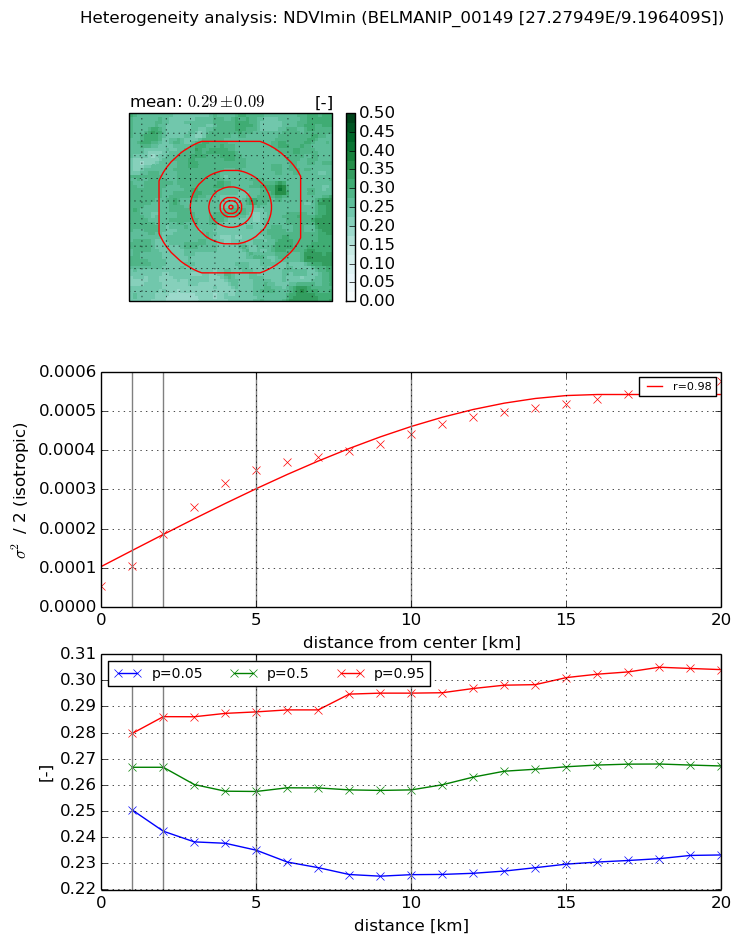
Heterogeneity analysis

The heterogeneity analysis provides information about the spatial and temporal heterogeneity of the site.

Topography


Roman et al. (2009) index


St

2.21603145876

Rcv

0.368331502095

Rse

0.0

Rst

-1.46739582725e-06

Rsv

-0.985438425831


Height range @ 1km [m]

46

Height range @ 2km [m]

66

Height range @ 5km [m]

108

Height range @ 10km [m]

-999

Height range @ 20km [m]

-999


Variance slope @ 1 km

142

Variance slope @ 2 km

161

Variance slope @ 5 km

223

Variance slope @ 10 km

-999

Variance slope @ 20 km

-999


NDVI (max. NDVI composite)


Roman et al. (2009) index


St

4.91537238246

Rcv

0.0643442723289

Rse

0.0

Rst

0.198109454391

Rsv

-0.347876430707


NDVI range @ 1km [-]

0.01

NDVI range @ 2km [-]

0.02

NDVI range @ 5km [-]

0.03

NDVI range @ 10km [-]

0.04

NDVI range @ 20km [-]

0.05


Variance slope @ 1 km

2.25679071865e-05

Variance slope @ 2 km

2.95583563712e-05

Variance slope @ 5 km

2.75433962778e-05

Variance slope @ 10 km

1.58711651152e-05

Variance slope @ 20 km

5.18748977404e-06


NDVI (min. NDVI composite)I


Roman et al. (2009) index


St

6.8276549453

Rcv

0.0318225266196

Rse

0.0

Rst

0.162339102845

Rsv

-0.245227886268


NDVI range @ 1km [-]

0.03

NDVI range @ 2km [-]

0.04

NDVI range @ 5km [-]

0.05

NDVI range @ 10km [-]

0.07

NDVI range @ 20km [-]

0.07


NDVI slope @ 1 km

4.99967555935e-05

NDVI slope @ 2 km

6.65723474183e-05

NDVI slope @ 5 km

6.23589267969e-05

NDVI slope @ 10 km

3.75483687286e-05

NDVI slope @ 20 km

2.28454825403e-05


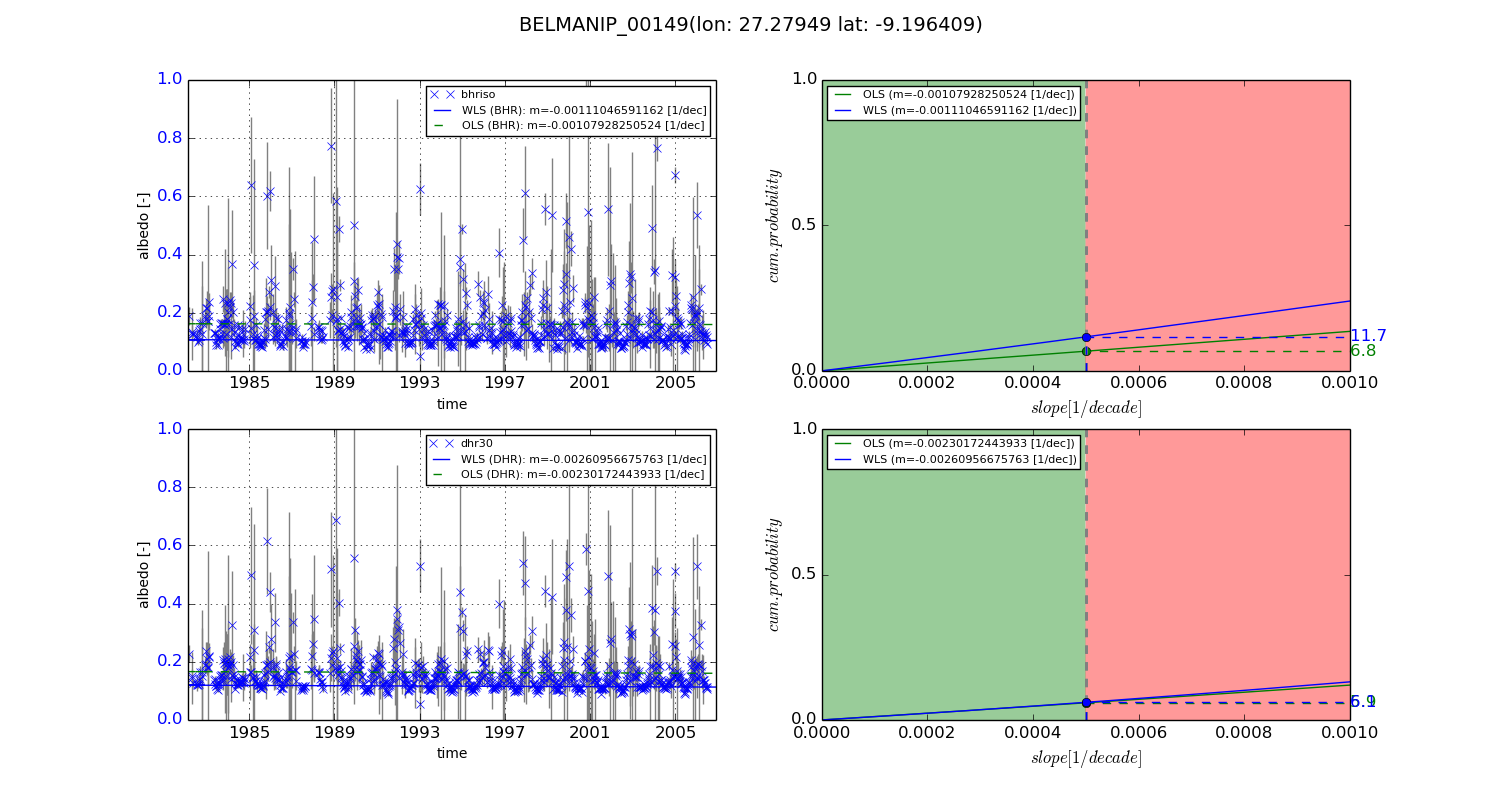
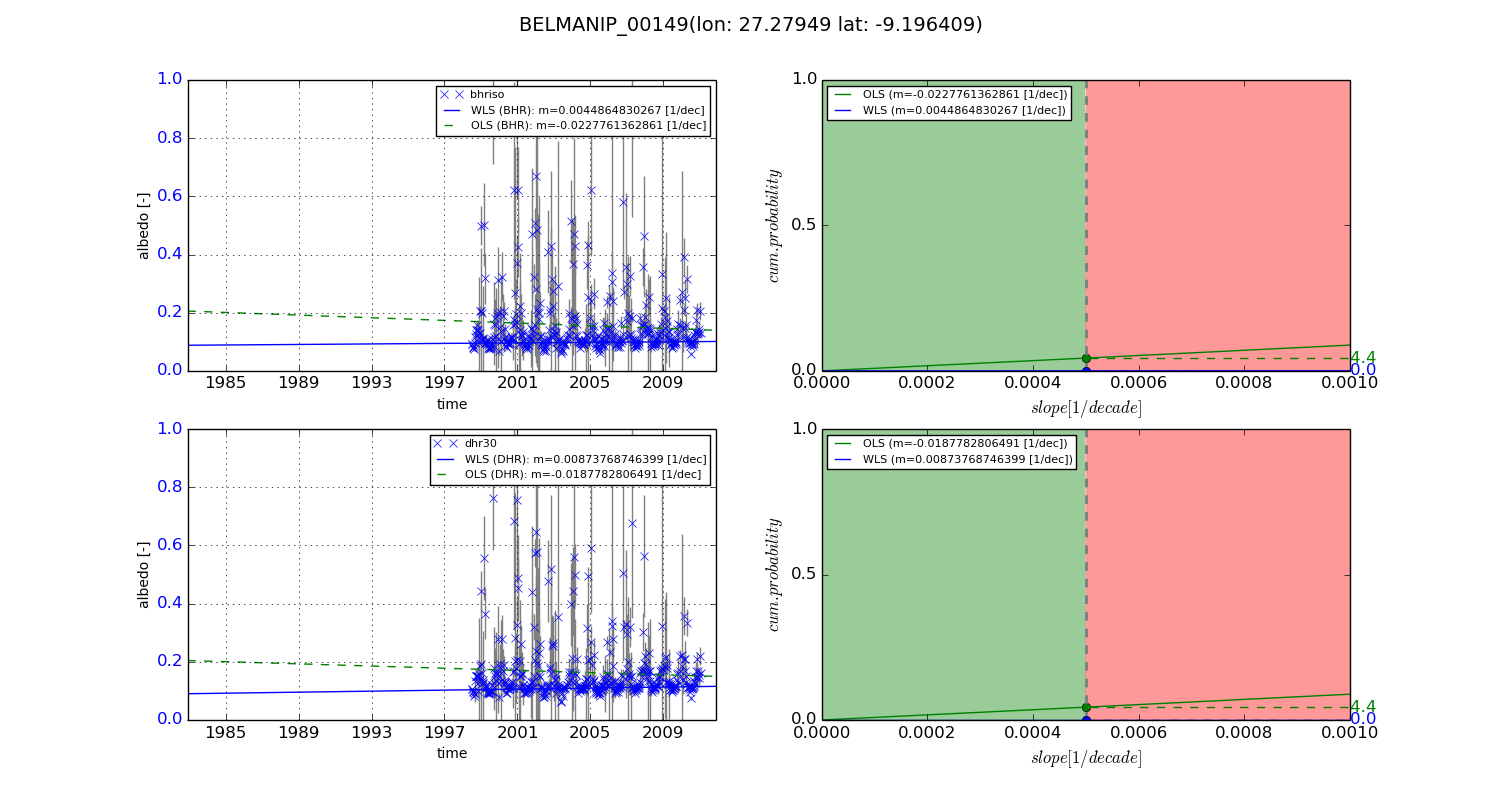
Temporal stability analysis

+000 deg (BHR)


BHR statistics

Temporal stability [1/decade]:


abs

rel


Weighted least square:

-0.00111046591162


Ordinary least square:

-0.00107928250524


Probabilities that GCOS criteria is met:

Weighted least square:

11.7 %

Ordinary least square:

6.8 %


DHR statistics

Temporal stability [1/decade]:


abs

rel


Weighted least square:

-0.00260956675763


Ordinary least square:

-0.00230172443933


Probabilities that GCOS criteria is met:

Weighted least square:

6.1 %

Ordinary least square:

5.9 %


+057/+063 deg (BHR)


BHR statistics

Temporal stability [1/decade]:


abs

rel


Weighted least square:

0.0044864830267


Ordinary least square:

-0.0227761362861


Probabilities that GCOS criteria is met:

Weighted least square:

0.0 %

Ordinary least square:

4.4 %


DHR statistics

Temporal stability [1/decade]:


abs

rel


Weighted least square:

0.00873768746399


Ordinary least square:

-0.0187782806491


Probabilities that GCOS criteria is met:

Weighted least square:

0.0 %

Ordinary least square:

4.4 %


Temporal anomaly analyis

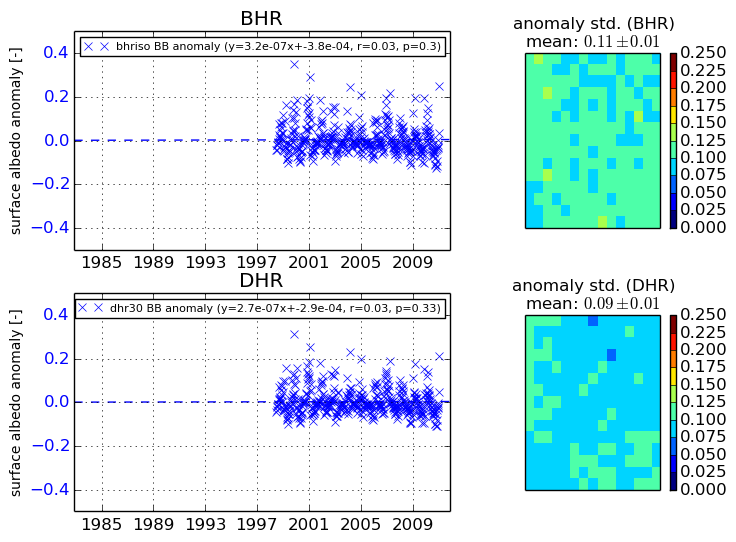
The variance of the temporal anomalies provides an additional measure about the stability of the signal AFTER removal of the mean seasonal cylce.
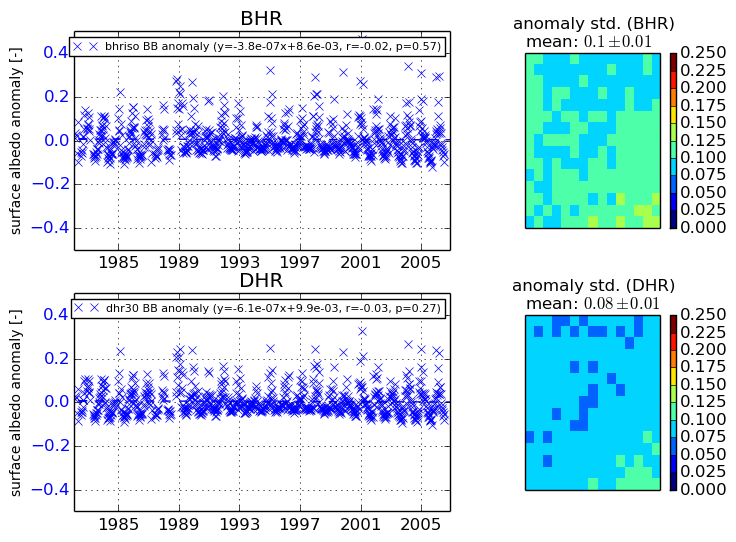
+000 deg


+057/+063 deg