BELMANIP_00150


Location

lon / lat [deg]: 40.4548 / -0.1805

Source network: BELMANIP


Geostationary surface albedo (GSA) data


“+000”


“+057/+063”


Landcover information (based on ESA CCI landcover data)


Landcover fractions @ 2km distance


Landcover fractions @ 20 km distance


Legend


Distance to open water bodies [km]:

none in region

Distance to urban areas [km]:

29.17


Radius: 1 km

Number of landcover classes:

1

Dominant landcover type:

120: Shrubland

Fraction of dominant landcover type [%]:

100.0


Radius: 2 km

Number of landcover classes:

1

Dominant landcover type:

120: Shrubland

Fraction of dominant landcover type [%]:

100.0


Radius: 5 km

Number of landcover classes:

1

Dominant landcover type:

120: Shrubland

Fraction of dominant landcover type [%]:

100.0


Radius: 10 km

Number of landcover classes:

2

Dominant landcover type:

120: Shrubland

Fraction of dominant landcover type [%]:

94.0


Radius: 20 km

Number of landcover classes:

4

Dominant landcover type:

120: Shrubland

Fraction of dominant landcover type [%]:

86.0


Disturbances


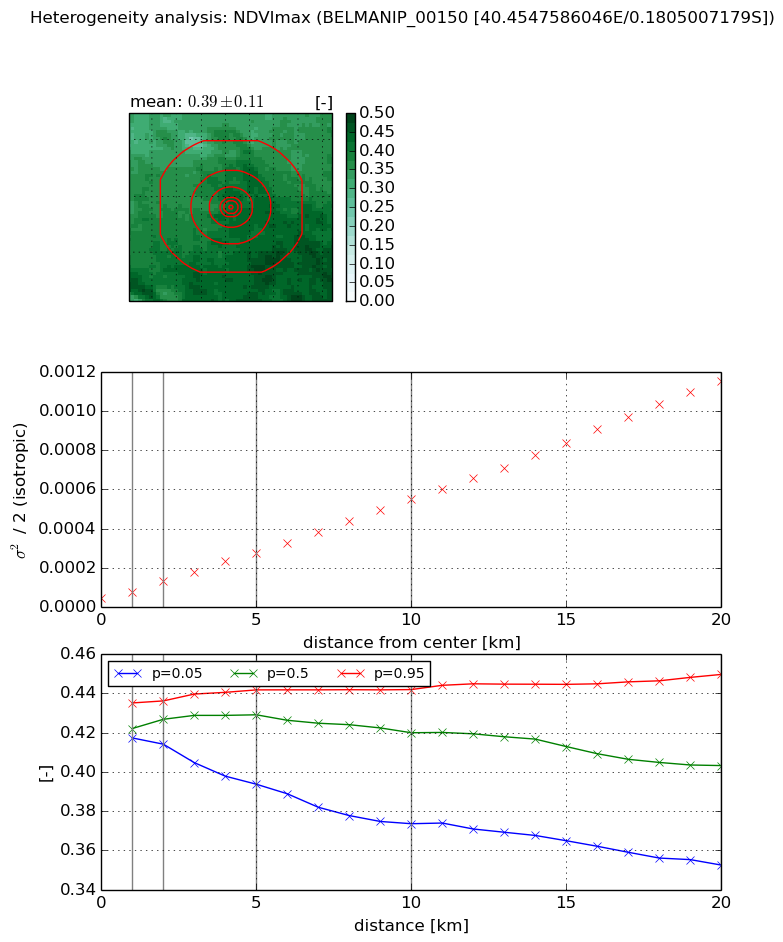
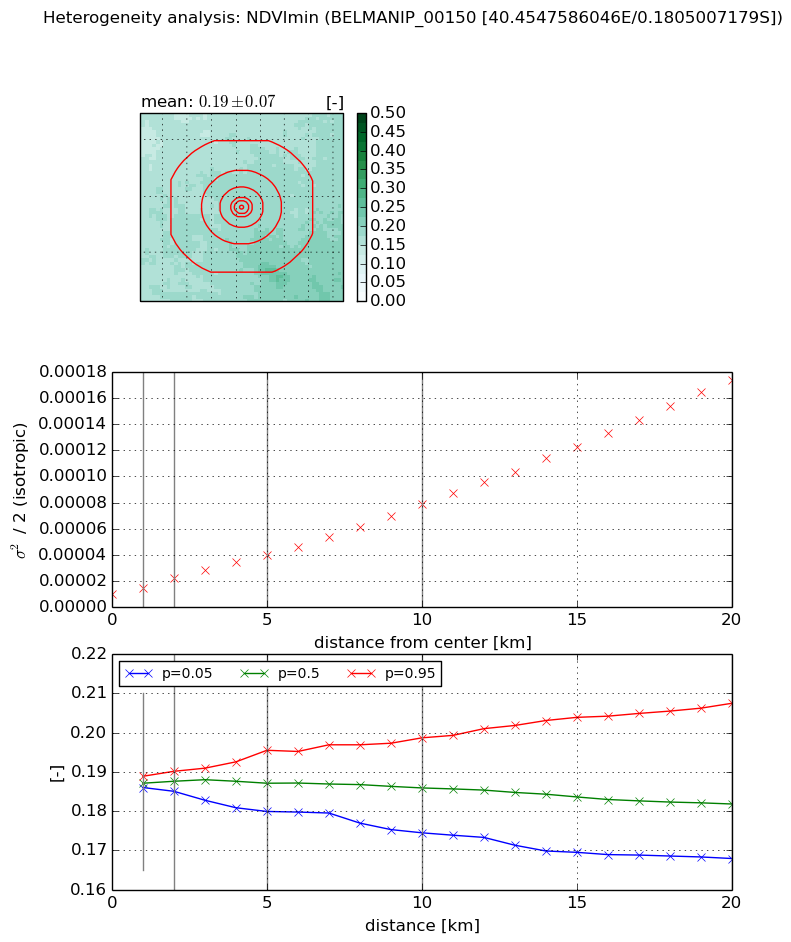
Heterogeneity analysis

The heterogeneity analysis provides information about the spatial and temporal heterogeneity of the site.

Topography


Roman et al. (2009) index


St

4.18801588736

Rcv

0.515898007159

Rse

0.0

Rst

0.0508421994813

Rsv

0.149589454156


Height range @ 1km [m]

4

Height range @ 2km [m]

5

Height range @ 5km [m]

9

Height range @ 10km [m]

-999

Height range @ 20km [m]

-999


Variance slope @ 1 km

2

Variance slope @ 2 km

2

Variance slope @ 5 km

2

Variance slope @ 10 km

-999

Variance slope @ 20 km

-999


NDVI (max. NDVI composite)


Roman et al. (2009) index


St

3.67603838563e-06

Rcv

0.413287015692

Rse

0.0

Rst

0.214434644615

Rsv

816095.31179


NDVI range @ 1km [-]

0.02

NDVI range @ 2km [-]

0.02

NDVI range @ 5km [-]

0.05

NDVI range @ 10km [-]

0.07

NDVI range @ 20km [-]

0.1


Variance slope @ 1 km

3.11195140282e-05

Variance slope @ 2 km

4.20130299334e-05

Variance slope @ 5 km

4.7849409896e-05

Variance slope @ 10 km

5.11354192829e-05

Variance slope @ 20 km

5.60128267392e-05


NDVI (min. NDVI composite)I


Roman et al. (2009) index


St

2.81962537658e-07

Rcv

0.674248517985

Rse

0.0

Rst

0.10643549601

Rsv

10639710.5261


NDVI range @ 1km [-]

0.0

NDVI range @ 2km [-]

0.01

NDVI range @ 5km [-]

0.02

NDVI range @ 10km [-]

0.02

NDVI range @ 20km [-]

0.04


NDVI slope @ 1 km

5.02913770897e-06

NDVI slope @ 2 km

6.33222590863e-06

NDVI slope @ 5 km

6.11852985455e-06

NDVI slope @ 10 km

6.72352485124e-06

NDVI slope @ 20 km

8.25167371167e-06


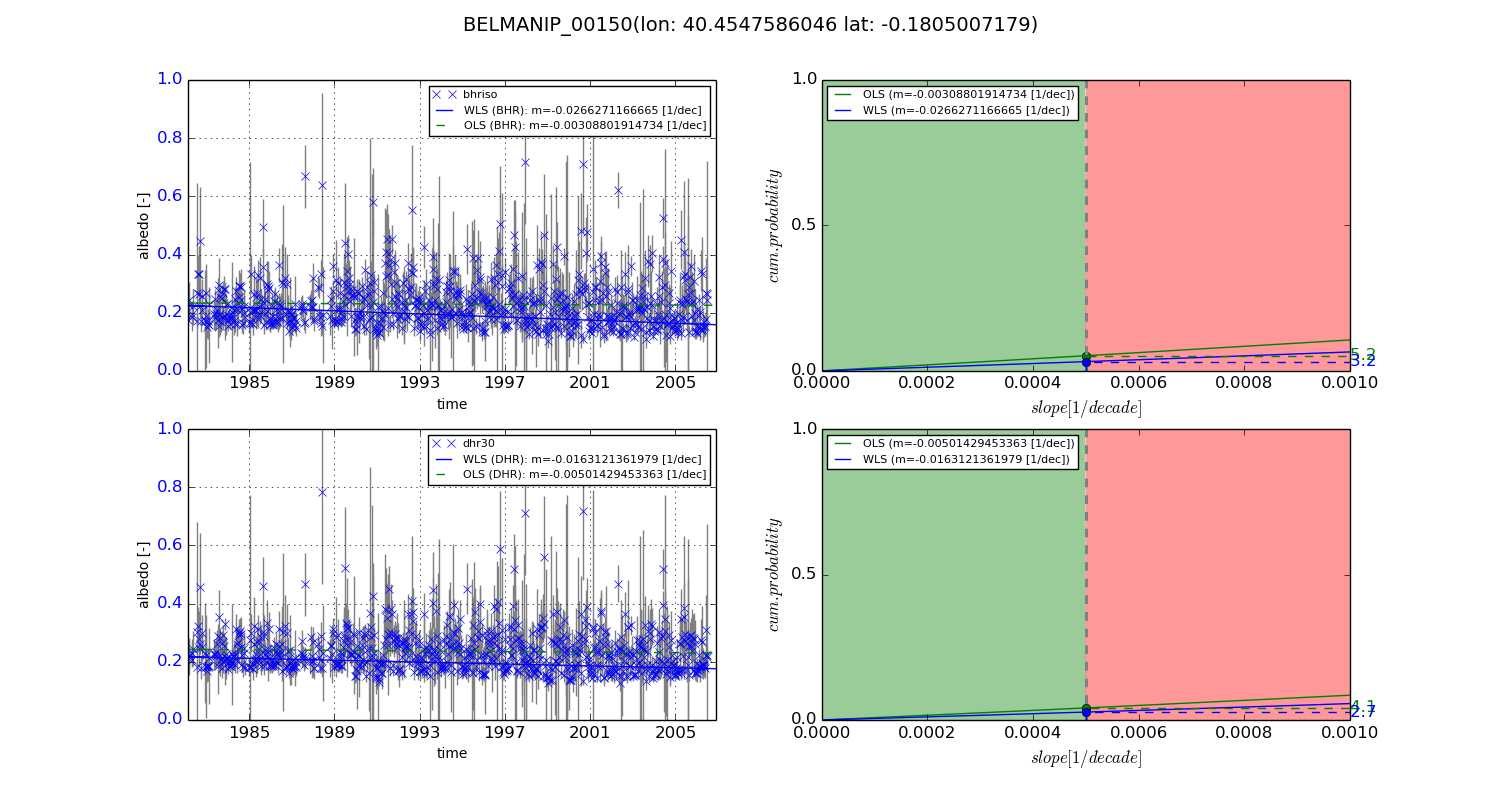
Temporal stability analysis

+000 deg (BHR)


BHR statistics

Temporal stability [1/decade]:


abs

rel


Weighted least square:

-0.0266271166665


Ordinary least square:

-0.00308801914734


Probabilities that GCOS criteria is met:

Weighted least square:

3.2 %

Ordinary least square:

5.2 %


DHR statistics

Temporal stability [1/decade]:


abs

rel


Weighted least square:

-0.0163121361979


Ordinary least square:

-0.00501429453363


Probabilities that GCOS criteria is met:

Weighted least square:

2.7 %

Ordinary least square:

4.1 %


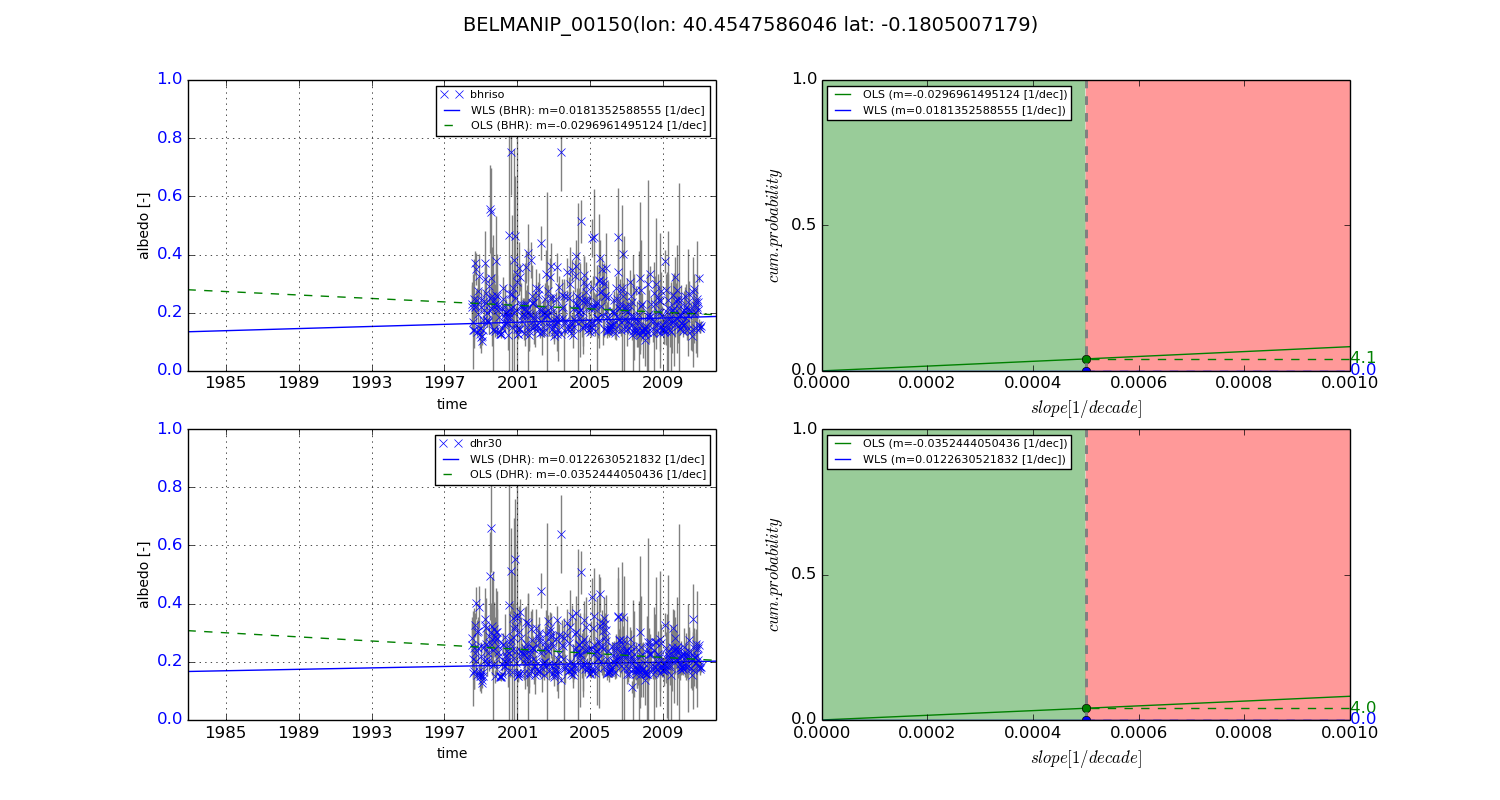
+057/+063 deg (BHR)


BHR statistics

Temporal stability [1/decade]:


abs

rel


Weighted least square:

0.0181352588555


Ordinary least square:

-0.0296961495124


Probabilities that GCOS criteria is met:

Weighted least square:

0.0 %

Ordinary least square:

4.1 %


DHR statistics

Temporal stability [1/decade]:


abs

rel


Weighted least square:

0.0122630521832


Ordinary least square:

-0.0352444050436


Probabilities that GCOS criteria is met:

Weighted least square:

0.0 %

Ordinary least square:

4.0 %


Temporal anomaly analyis

The variance of the temporal anomalies provides an additional measure about the stability of the signal AFTER removal of the mean seasonal cylce.

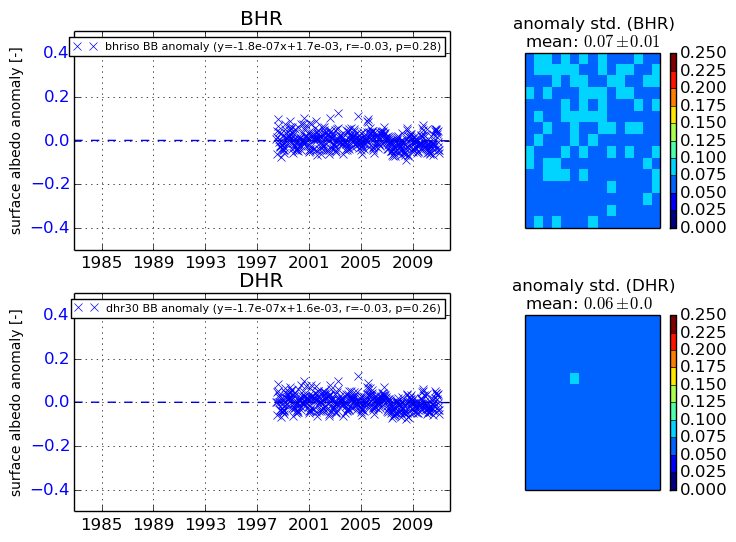
+000 deg


+057/+063 deg