BELMANIP_00151


Location

lon / lat [deg]: 35.1915 / -2.6738

Source network: BELMANIP


Geostationary surface albedo (GSA) data


“+000”


“+057/+063”


Landcover information (based on ESA CCI landcover data)


Landcover fractions @ 2km distance


Landcover fractions @ 20 km distance


Legend


Distance to open water bodies [km]:

36.5

Distance to urban areas [km]:

none in region


Radius: 1 km

Number of landcover classes:

1

Dominant landcover type:

130: grassland

Fraction of dominant landcover type [%]:

100.0


Radius: 2 km

Number of landcover classes:

1

Dominant landcover type:

130: grassland

Fraction of dominant landcover type [%]:

100.0


Radius: 5 km

Number of landcover classes:

2

Dominant landcover type:

130: grassland

Fraction of dominant landcover type [%]:

98.0


Radius: 10 km

Number of landcover classes:

2

Dominant landcover type:

130: grassland

Fraction of dominant landcover type [%]:

92.0


Radius: 20 km

Number of landcover classes:

2

Dominant landcover type:

130: grassland

Fraction of dominant landcover type [%]:

92.0


Disturbances


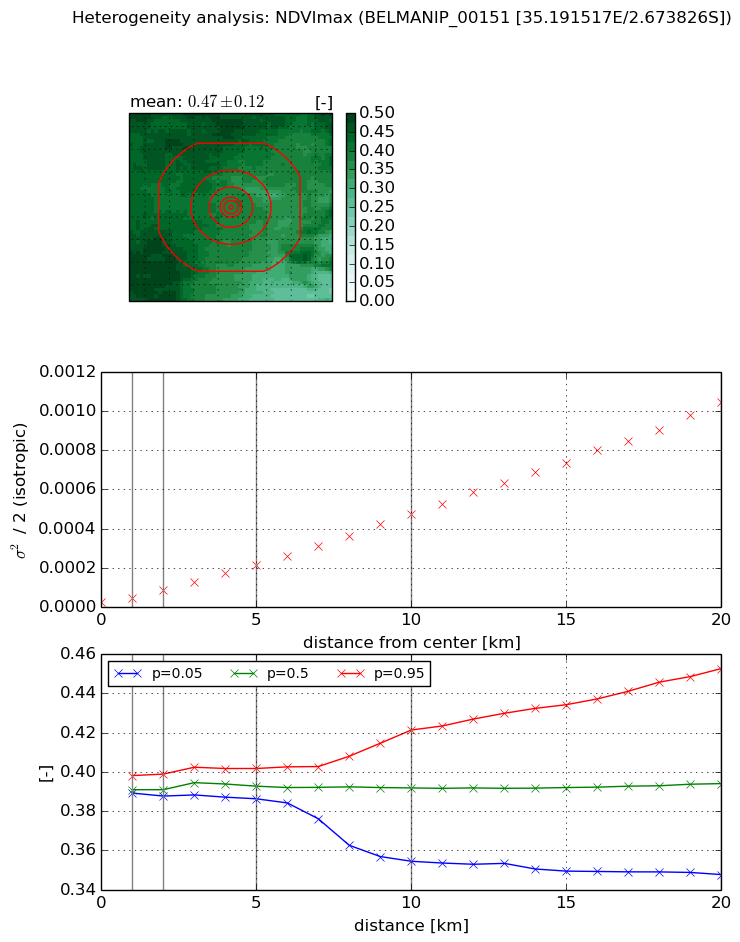
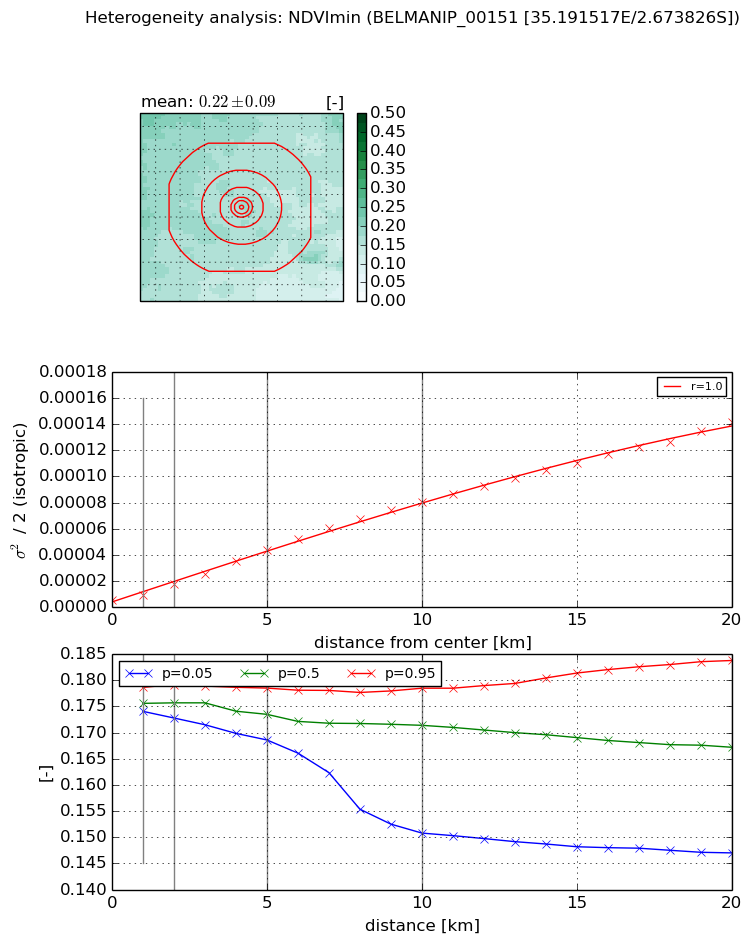
Heterogeneity analysis

The heterogeneity analysis provides information about the spatial and temporal heterogeneity of the site.

Topography


Roman et al. (2009) index


St

2.62035476219

Rcv

0.54085342656

Rse

0.0

Rst

-6.74596617754e-06

Rsv

-0.604022972035


Height range @ 1km [m]

13

Height range @ 2km [m]

24

Height range @ 5km [m]

57

Height range @ 10km [m]

-999

Height range @ 20km [m]

-999


Variance slope @ 1 km

30

Variance slope @ 2 km

42

Variance slope @ 5 km

65

Variance slope @ 10 km

-999

Variance slope @ 20 km

-999


NDVI (max. NDVI composite)


Roman et al. (2009) index


St

nan

Rcv

nan

Rse

nan

Rst

nan

Rsv

nan


NDVI range @ 1km [-]

0.01

NDVI range @ 2km [-]

0.01

NDVI range @ 5km [-]

0.02

NDVI range @ 10km [-]

0.07

NDVI range @ 20km [-]

0.11


Variance slope @ 1 km

2.17775519719e-05

Variance slope @ 2 km

3.05252993624e-05

Variance slope @ 5 km

3.93177061758e-05

Variance slope @ 10 km

4.58007929227e-05

Variance slope @ 20 km

5.15071784303e-05


NDVI (min. NDVI composite)I


Roman et al. (2009) index


St

3.43478483015

Rcv

0.140370225442

Rse

0.0

Rst

0.3046301213

Rsv

-0.428416809893


NDVI range @ 1km [-]

0.0

NDVI range @ 2km [-]

0.01

NDVI range @ 5km [-]

0.01

NDVI range @ 10km [-]

0.03

NDVI range @ 20km [-]

0.04


NDVI slope @ 1 km

4.476539878e-06

NDVI slope @ 2 km

6.26488329957e-06

NDVI slope @ 5 km

7.94654381489e-06

NDVI slope @ 10 km

7.91837483515e-06

NDVI slope @ 20 km

6.82625760813e-06


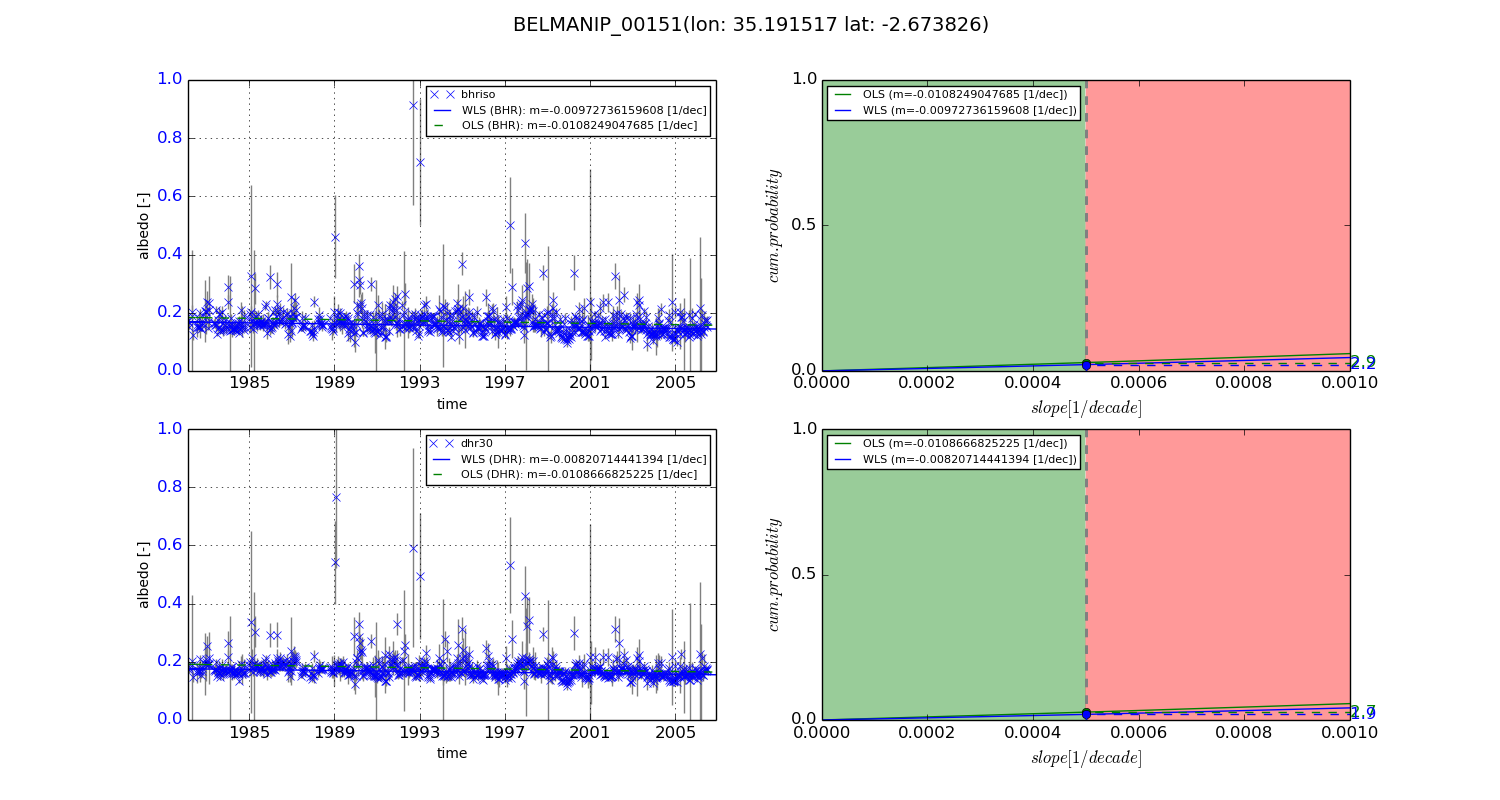
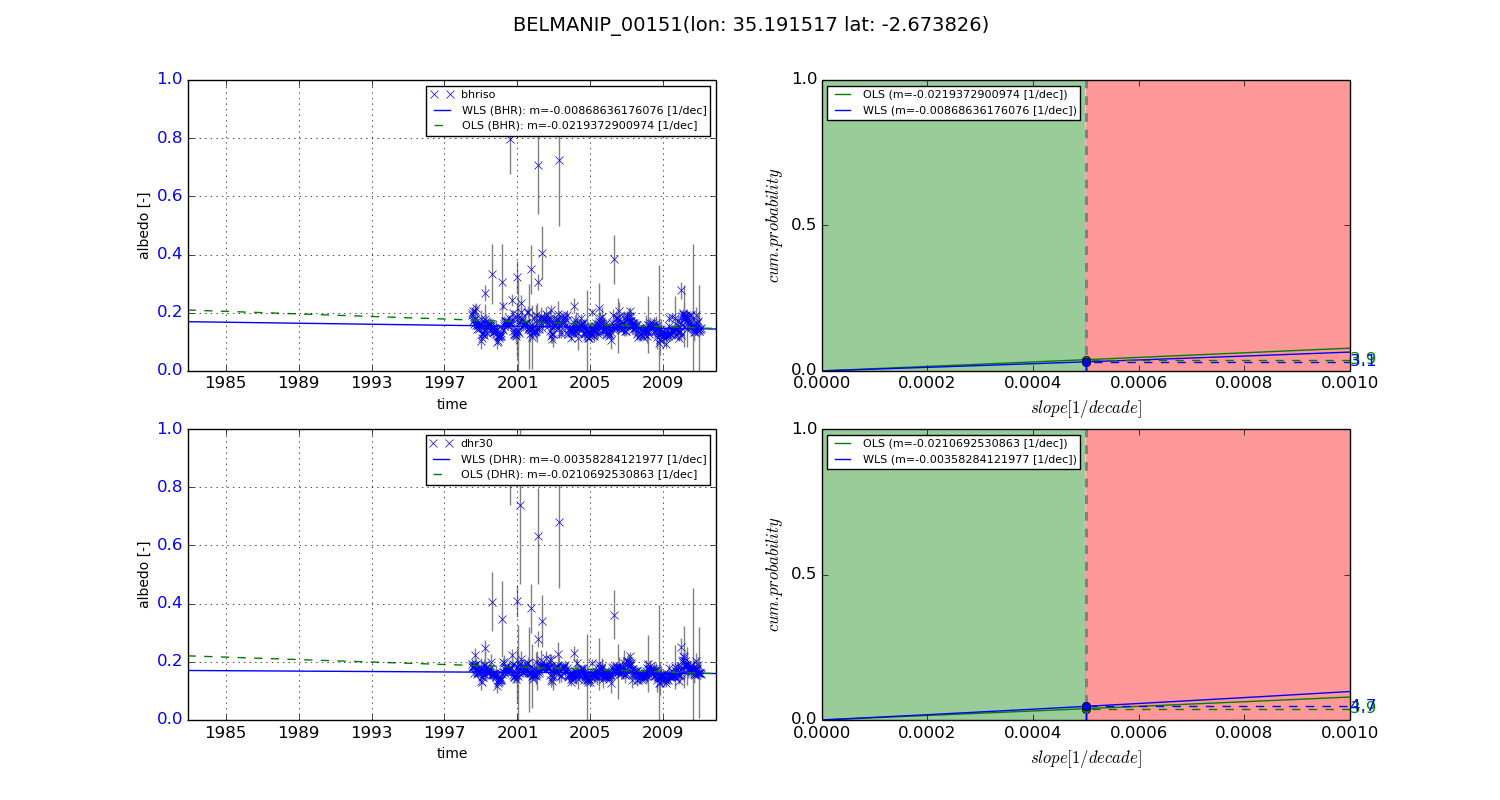
Temporal stability analysis

+000 deg (BHR)


BHR statistics

Temporal stability [1/decade]:


abs

rel


Weighted least square:

-0.00972736159608


Ordinary least square:

-0.0108249047685


Probabilities that GCOS criteria is met:

Weighted least square:

2.2 %

Ordinary least square:

2.9 %


DHR statistics

Temporal stability [1/decade]:


abs

rel


Weighted least square:

-0.00820714441394


Ordinary least square:

-0.0108666825225


Probabilities that GCOS criteria is met:

Weighted least square:

1.9 %

Ordinary least square:

2.7 %


+057/+063 deg (BHR)


BHR statistics

Temporal stability [1/decade]:


abs

rel


Weighted least square:

-0.00868636176076


Ordinary least square:

-0.0219372900974


Probabilities that GCOS criteria is met:

Weighted least square:

3.1 %

Ordinary least square:

3.9 %


DHR statistics

Temporal stability [1/decade]:


abs

rel


Weighted least square:

-0.00358284121977


Ordinary least square:

-0.0210692530863


Probabilities that GCOS criteria is met:

Weighted least square:

4.7 %

Ordinary least square:

3.9 %


Temporal anomaly analyis

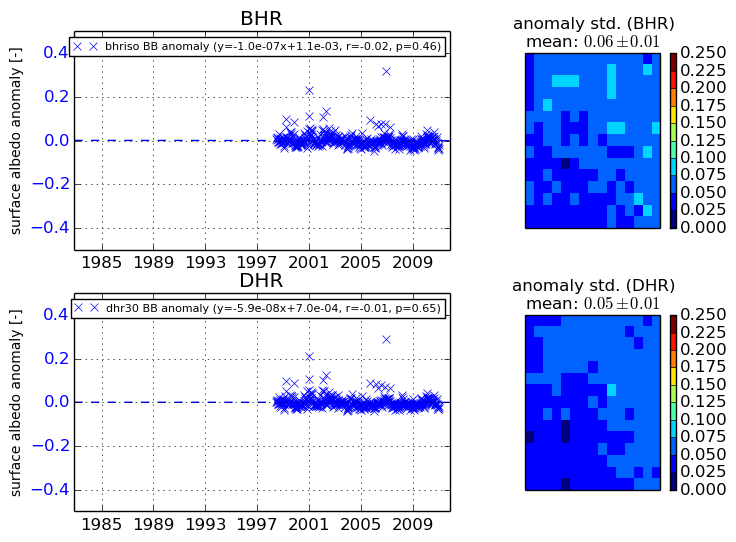
The variance of the temporal anomalies provides an additional measure about the stability of the signal AFTER removal of the mean seasonal cylce.
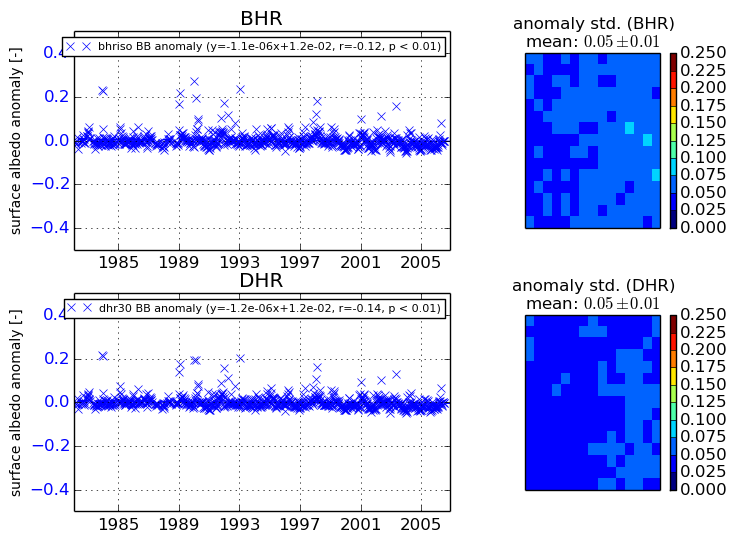
+000 deg


+057/+063 deg