BELMANIP_00152


Location

lon / lat [deg]: 32.8733 / -5.076

Source network: BELMANIP


Geostationary surface albedo (GSA) data


“+000”


“+057/+063”


Landcover information (based on ESA CCI landcover data)


Landcover fractions @ 2km distance


Landcover fractions @ 20 km distance


Legend


Distance to open water bodies [km]:

7.8

Distance to urban areas [km]:

6.06


Radius: 1 km

Number of landcover classes:

1

Dominant landcover type:

10: cropland, rainfed

Fraction of dominant landcover type [%]:

100.0


Radius: 2 km

Number of landcover classes:

2

Dominant landcover type:

10: cropland, rainfed

Fraction of dominant landcover type [%]:

98.0


Radius: 5 km

Number of landcover classes:

2

Dominant landcover type:

10: cropland, rainfed

Fraction of dominant landcover type [%]:

98.0


Radius: 10 km

Number of landcover classes:

5

Dominant landcover type:

10: cropland, rainfed

Fraction of dominant landcover type [%]:

86.0


Radius: 20 km

Number of landcover classes:

5

Dominant landcover type:

10: cropland, rainfed

Fraction of dominant landcover type [%]:

82.0


Disturbances


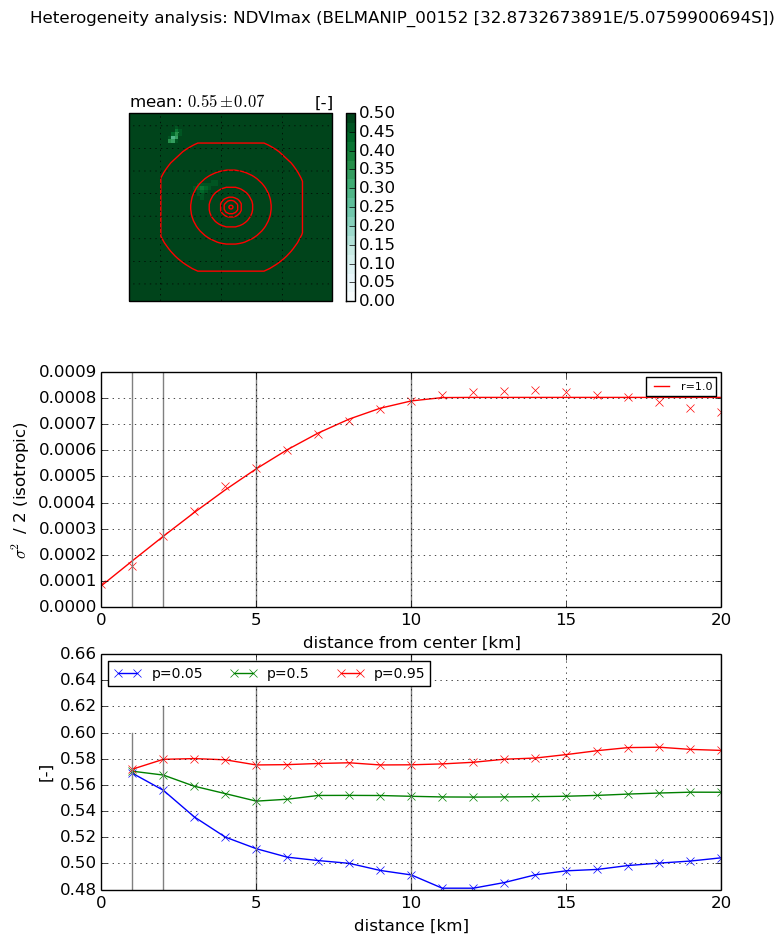
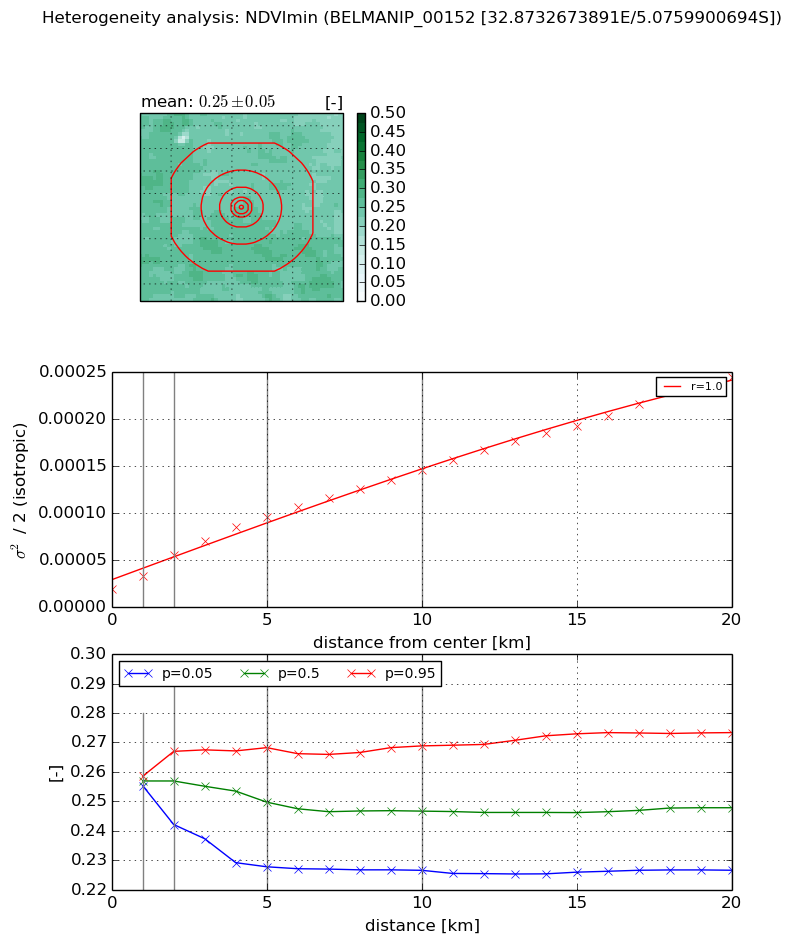
Heterogeneity analysis

The heterogeneity analysis provides information about the spatial and temporal heterogeneity of the site.

Topography


Roman et al. (2009) index


St

0.049328789337

Rcv

0.367290495847

Rse

0.0

Rst

6.22424072894e-06

Rsv

60.4491157709


Height range @ 1km [m]

16

Height range @ 2km [m]

33

Height range @ 5km [m]

63

Height range @ 10km [m]

-999

Height range @ 20km [m]

-999


Variance slope @ 1 km

77

Variance slope @ 2 km

83

Variance slope @ 5 km

89

Variance slope @ 10 km

-999

Variance slope @ 20 km

-999


NDVI (max. NDVI composite)


Roman et al. (2009) index


St

5.66715697427

Rcv

0.469402304678

Rse

0.0

Rst

0.0427389835901

Rsv

0.017224673117


NDVI range @ 1km [-]

0.0

NDVI range @ 2km [-]

0.02

NDVI range @ 5km [-]

0.06

NDVI range @ 10km [-]

0.08

NDVI range @ 20km [-]

0.08


Variance slope @ 1 km

7.00347526698e-05

Variance slope @ 2 km

9.13155228045e-05

Variance slope @ 5 km

9.25601522492e-05

Variance slope @ 10 km

7.2306241993e-05

Variance slope @ 20 km

3.1735969881e-05


NDVI (min. NDVI composite)I


Roman et al. (2009) index


St

1.92199699772

Rcv

0.319558740101

Rse

0.0

Rst

-0.241318198451

Rsv

-0.999999589117


NDVI range @ 1km [-]

0.0

NDVI range @ 2km [-]

0.02

NDVI range @ 5km [-]

0.04

NDVI range @ 10km [-]

0.04

NDVI range @ 20km [-]

0.05


NDVI slope @ 1 km

1.45710212087e-05

NDVI slope @ 2 km

1.80152365133e-05

NDVI slope @ 5 km

1.59414058676e-05

NDVI slope @ 10 km

1.2433086518e-05

NDVI slope @ 20 km

1.07343234853e-05


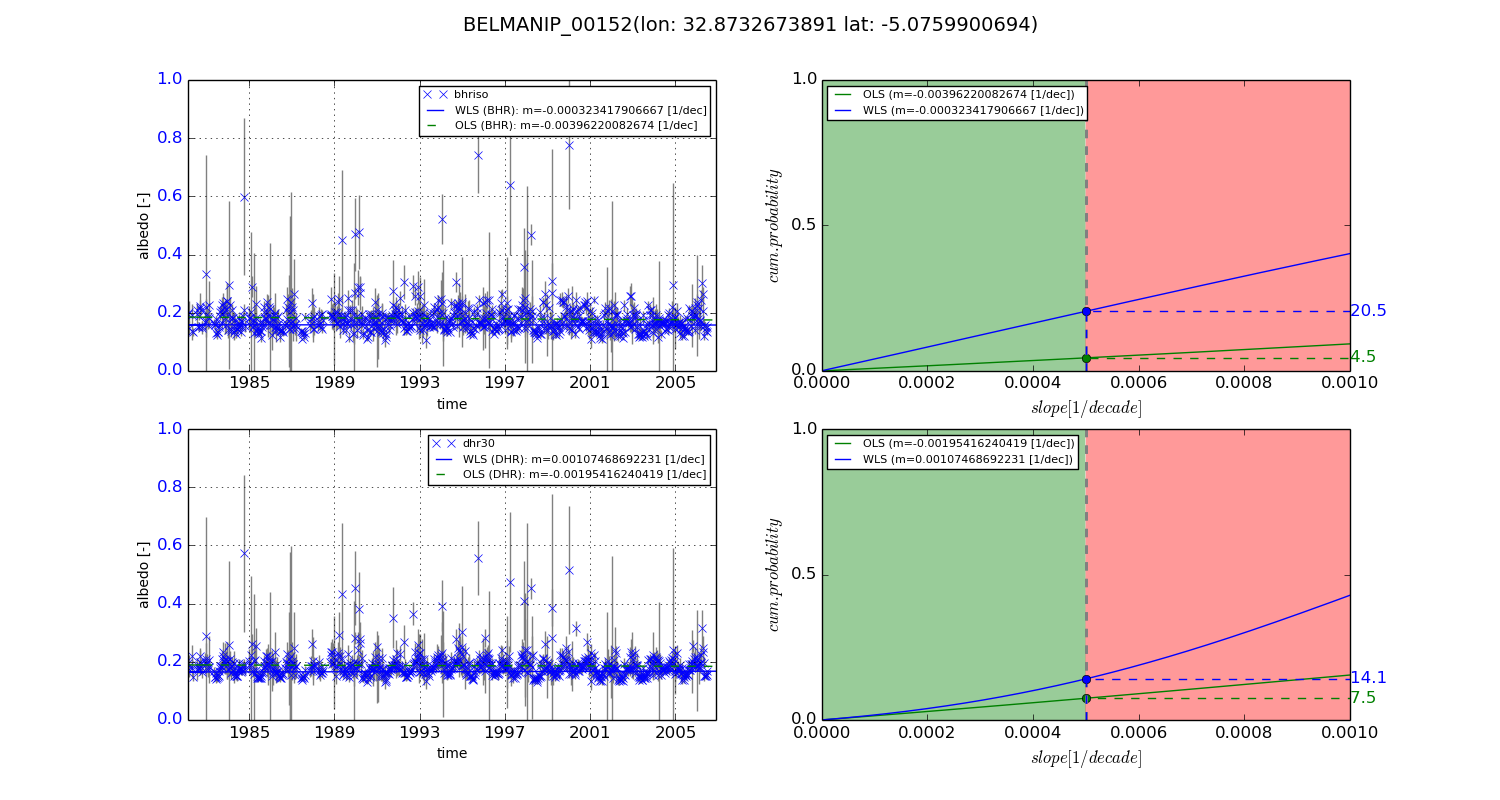
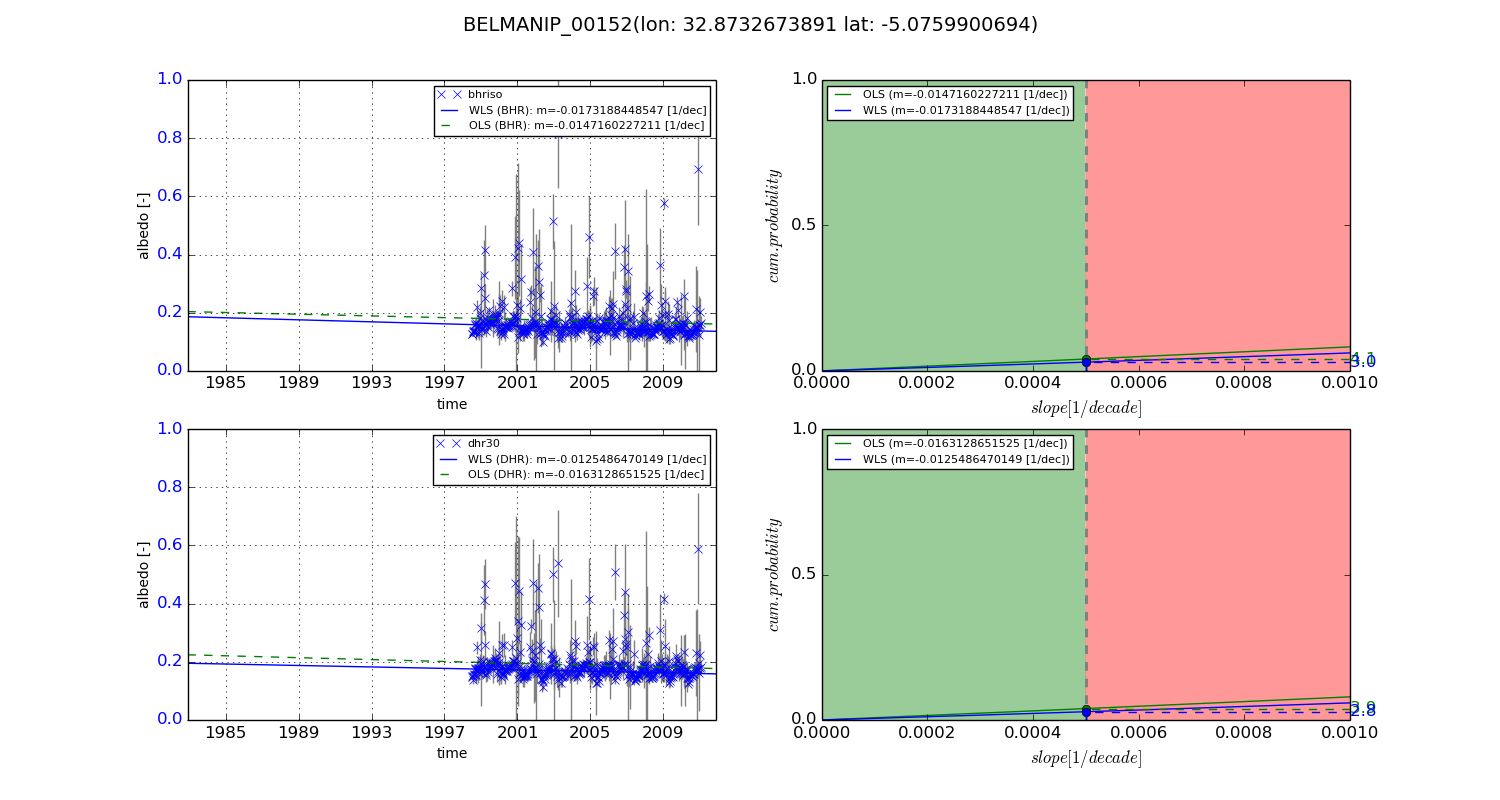
Temporal stability analysis

+000 deg (BHR)


BHR statistics

Temporal stability [1/decade]:


abs

rel


Weighted least square:

-0.000323417906667


Ordinary least square:

-0.00396220082674


Probabilities that GCOS criteria is met:

Weighted least square:

20.5 %

Ordinary least square:

4.5 %


DHR statistics

Temporal stability [1/decade]:


abs

rel


Weighted least square:

0.00107468692231


Ordinary least square:

-0.00195416240419


Probabilities that GCOS criteria is met:

Weighted least square:

14.1 %

Ordinary least square:

7.5 %


+057/+063 deg (BHR)


BHR statistics

Temporal stability [1/decade]:


abs

rel


Weighted least square:

-0.0173188448547


Ordinary least square:

-0.0147160227211


Probabilities that GCOS criteria is met:

Weighted least square:

3.0 %

Ordinary least square:

4.1 %


DHR statistics

Temporal stability [1/decade]:


abs

rel


Weighted least square:

-0.0125486470149


Ordinary least square:

-0.0163128651525


Probabilities that GCOS criteria is met:

Weighted least square:

2.8 %

Ordinary least square:

3.9 %


Temporal anomaly analyis

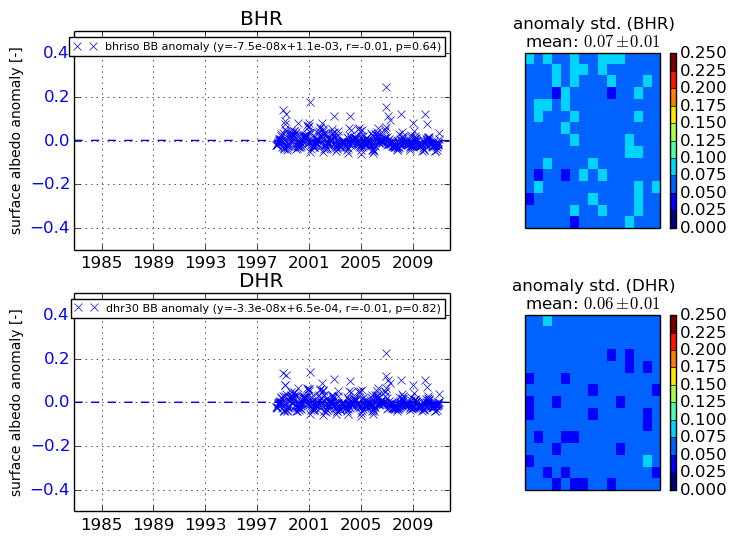
The variance of the temporal anomalies provides an additional measure about the stability of the signal AFTER removal of the mean seasonal cylce.
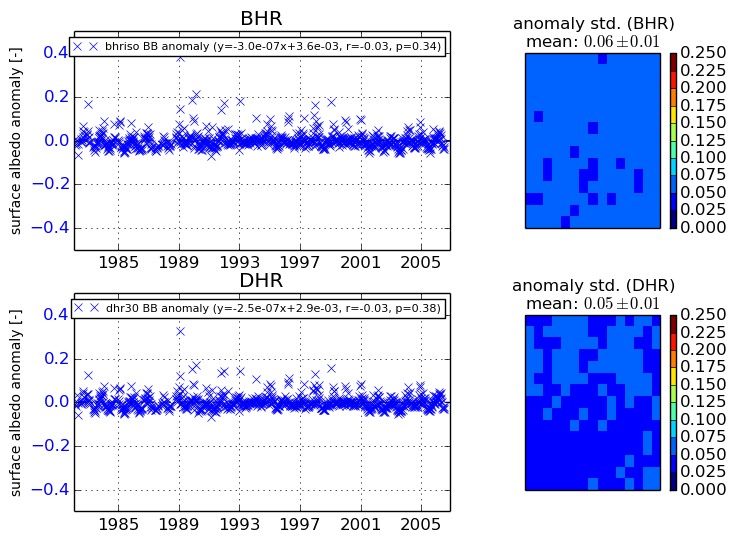
+000 deg


+057/+063 deg