BELMANIP_00156


Location

lon / lat [deg]: 35.2929 / 7.7741

Source network: BELMANIP


Geostationary surface albedo (GSA) data


“+000”


“+057/+063”


Landcover information (based on ESA CCI landcover data)


Landcover fractions @ 2km distance


Landcover fractions @ 20 km distance


Legend


Distance to open water bodies [km]:

52.17

Distance to urban areas [km]:

48.98


Radius: 1 km

Number of landcover classes:

1

Dominant landcover type:

50: Tree cover, broadleaved, evergreen, closed to open (>15%)

Fraction of dominant landcover type [%]:

100.0


Radius: 2 km

Number of landcover classes:

1

Dominant landcover type:

50: Tree cover, broadleaved, evergreen, closed to open (>15%)

Fraction of dominant landcover type [%]:

100.0


Radius: 5 km

Number of landcover classes:

2

Dominant landcover type:

50: Tree cover, broadleaved, evergreen, closed to open (>15%)

Fraction of dominant landcover type [%]:

94.0


Radius: 10 km

Number of landcover classes:

4

Dominant landcover type:

50: Tree cover, broadleaved, evergreen, closed to open (>15%)

Fraction of dominant landcover type [%]:

88.0


Radius: 20 km

Number of landcover classes:

5

Dominant landcover type:

50: Tree cover, broadleaved, evergreen, closed to open (>15%)

Fraction of dominant landcover type [%]:

66.0


Disturbances


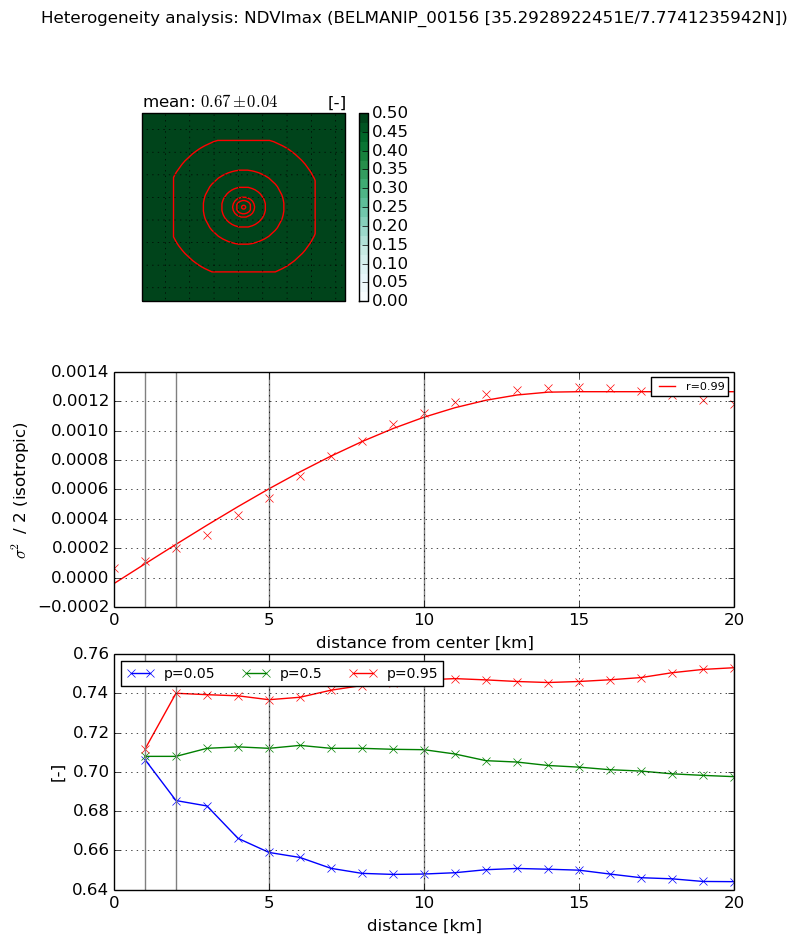
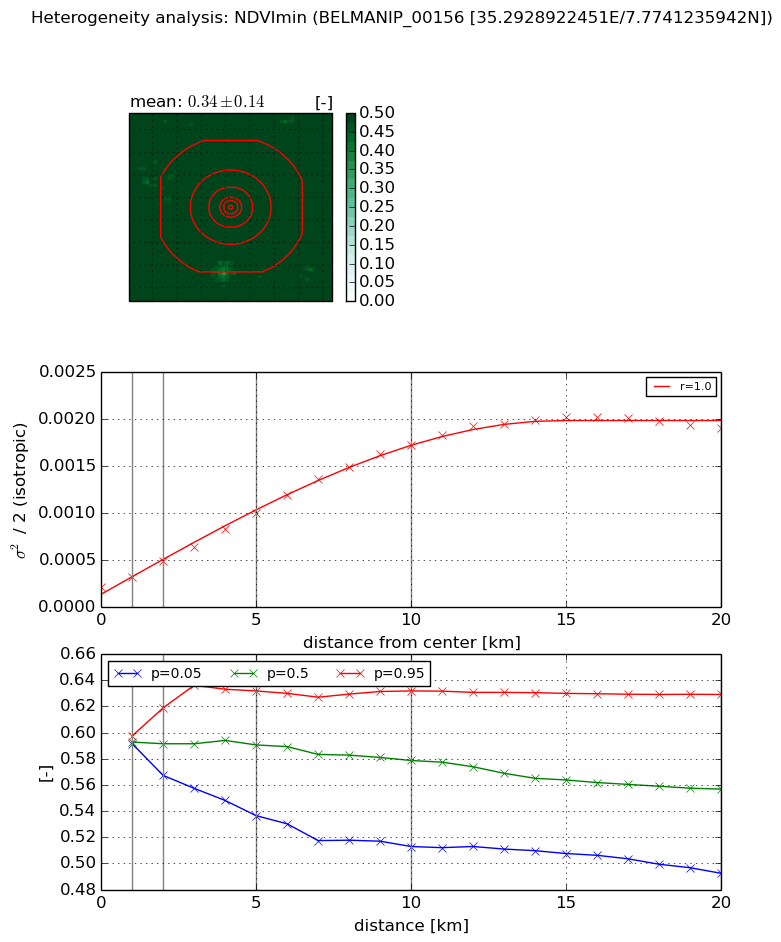
Heterogeneity analysis

The heterogeneity analysis provides information about the spatial and temporal heterogeneity of the site.

Topography


Roman et al. (2009) index


St

2.14525735091

Rcv

0.398433518406

Rse

0.0

Rst

-1.00169861253e-07

Rsv

-0.999999999996


Height range @ 1km [m]

277

Height range @ 2km [m]

377

Height range @ 5km [m]

764

Height range @ 10km [m]

-999

Height range @ 20km [m]

-999


Variance slope @ 1 km

6317

Variance slope @ 2 km

8743

Variance slope @ 5 km

12977

Variance slope @ 10 km

-999

Variance slope @ 20 km

-999


NDVI (max. NDVI composite)


Roman et al. (2009) index


St

1.94620550725

Rcv

0.338319141278

Rse

0.0

Rst

-0.146690925377

Rsv

1.0564509912


NDVI range @ 1km [-]

0.01

NDVI range @ 2km [-]

0.05

NDVI range @ 5km [-]

0.08

NDVI range @ 10km [-]

0.1

NDVI range @ 20km [-]

0.11


Variance slope @ 1 km

4.45253882251e-05

Variance slope @ 2 km

6.49025205156e-05

Variance slope @ 5 km

9.71624074603e-05

Variance slope @ 10 km

0.000113838925706

Variance slope @ 20 km

6.44487738293e-05


NDVI (min. NDVI composite)I


Roman et al. (2009) index


St

3.1116955031

Rcv

0.173450077913

Rse

0.0

Rst

-0.245083921609

Rsv

0.545570617081


NDVI range @ 1km [-]

0.01

NDVI range @ 2km [-]

0.05

NDVI range @ 5km [-]

0.1

NDVI range @ 10km [-]

0.12

NDVI range @ 20km [-]

0.14


NDVI slope @ 1 km

0.000102858863041

NDVI slope @ 2 km

0.000134759237306

NDVI slope @ 5 km

0.000159766104313

NDVI slope @ 10 km

0.000159847890006

NDVI slope @ 20 km

9.23438950736e-05


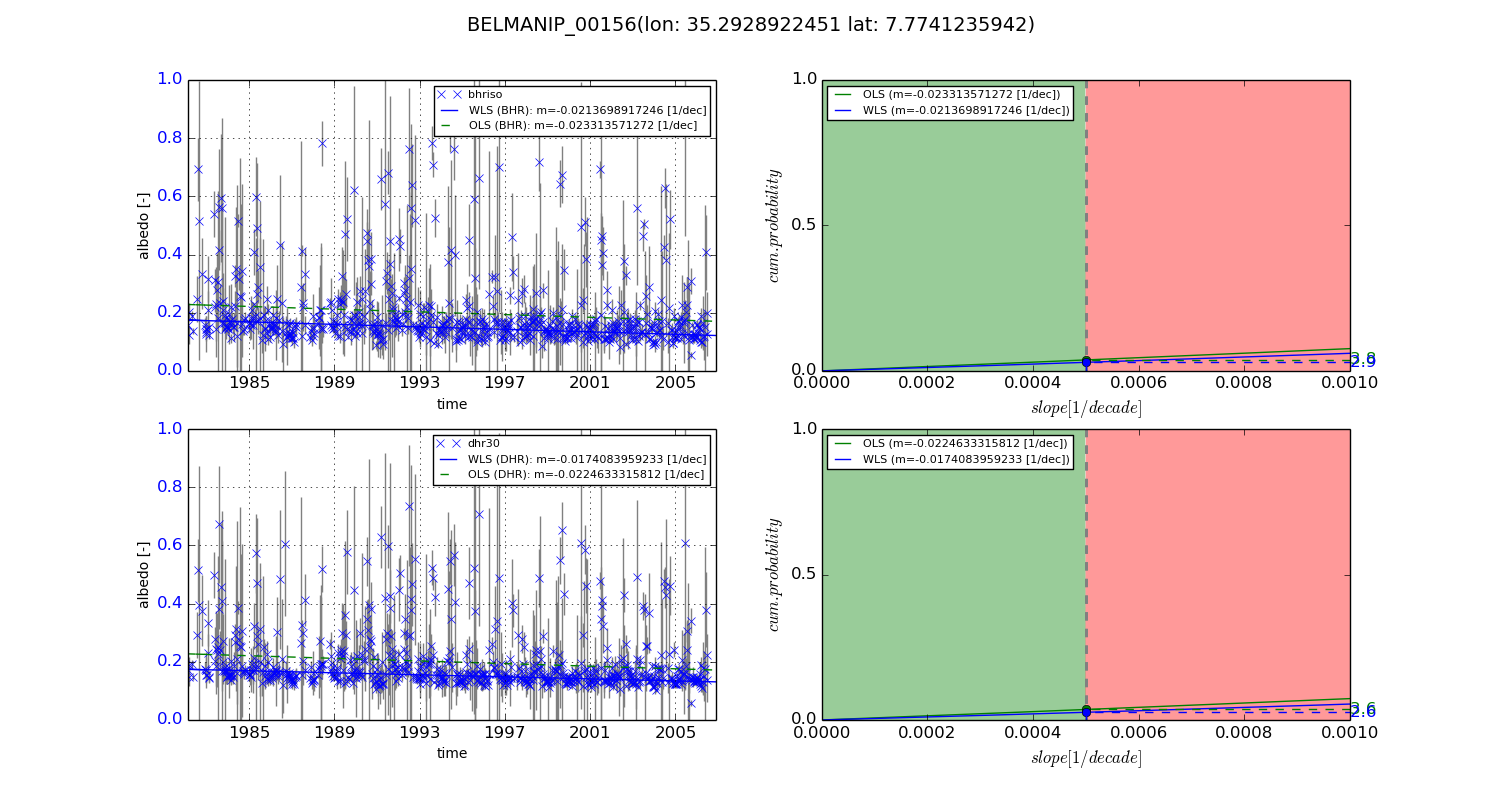
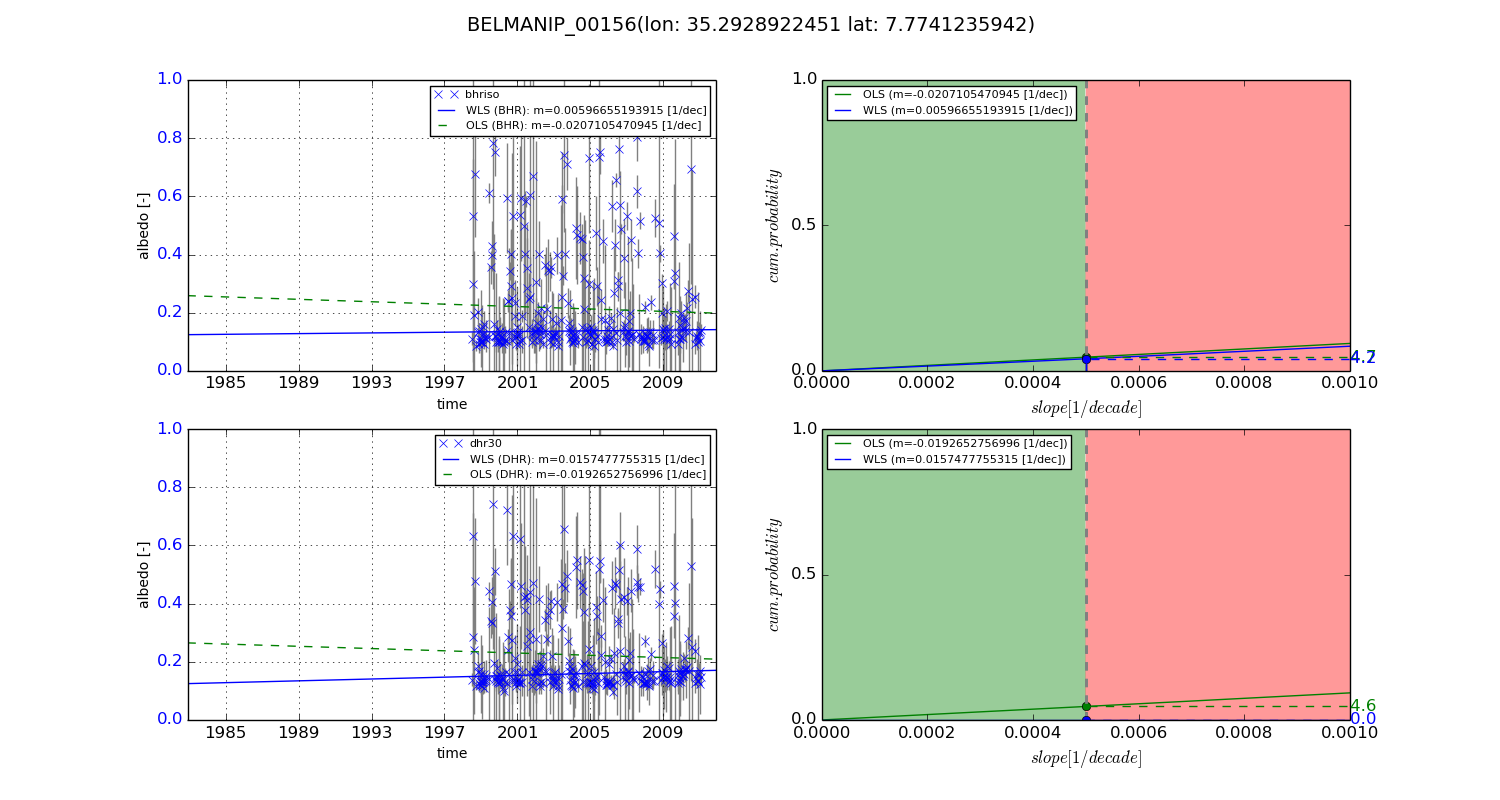
Temporal stability analysis

+000 deg (BHR)


BHR statistics

Temporal stability [1/decade]:


abs

rel


Weighted least square:

-0.0213698917246


Ordinary least square:

-0.023313571272


Probabilities that GCOS criteria is met:

Weighted least square:

2.9 %

Ordinary least square:

3.8 %


DHR statistics

Temporal stability [1/decade]:


abs

rel


Weighted least square:

-0.0174083959233


Ordinary least square:

-0.0224633315812


Probabilities that GCOS criteria is met:

Weighted least square:

2.6 %

Ordinary least square:

3.6 %


+057/+063 deg (BHR)


BHR statistics

Temporal stability [1/decade]:


abs

rel


Weighted least square:

0.00596655193915


Ordinary least square:

-0.0207105470945


Probabilities that GCOS criteria is met:

Weighted least square:

4.2 %

Ordinary least square:

4.7 %


DHR statistics

Temporal stability [1/decade]:


abs

rel


Weighted least square:

0.0157477755315


Ordinary least square:

-0.0192652756996


Probabilities that GCOS criteria is met:

Weighted least square:

0.0 %

Ordinary least square:

4.6 %


Temporal anomaly analyis

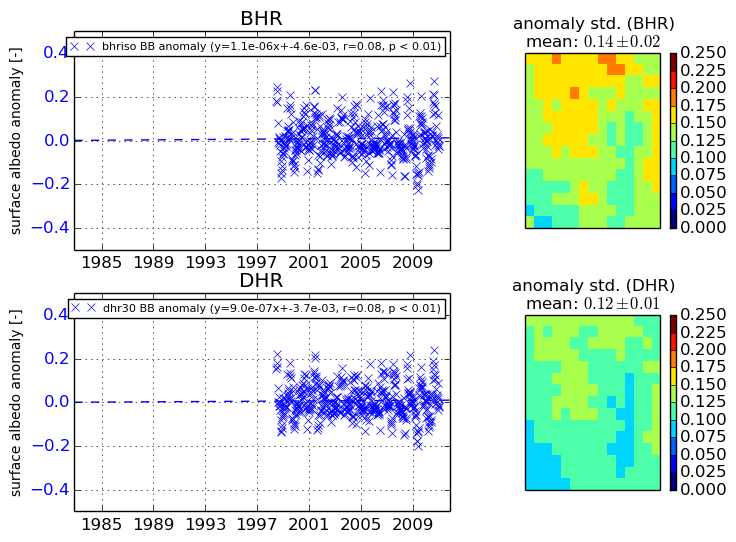
The variance of the temporal anomalies provides an additional measure about the stability of the signal AFTER removal of the mean seasonal cylce.
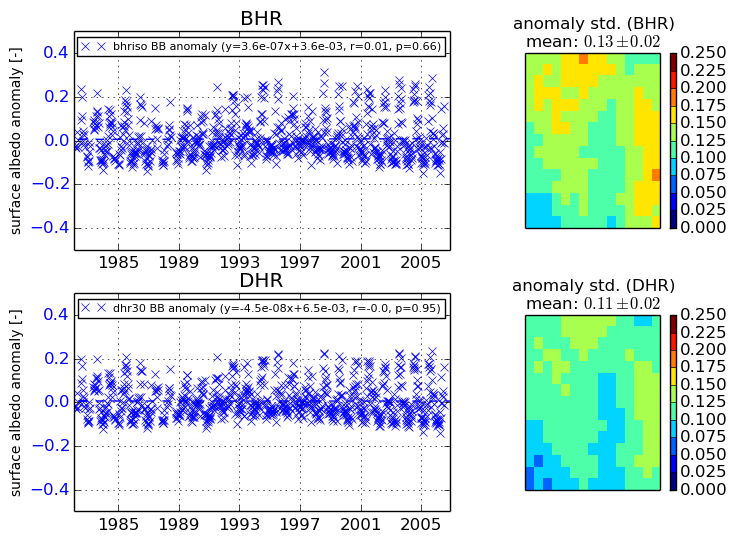
+000 deg


+057/+063 deg


By continuing to use this website, you are giving consent to analytic cookies being used. For more information on how EUMETSAT uses data and how you can disable this, please view this web page: Analytics Cookie Policy