BELMANIP_00158


Location

lon / lat [deg]: 13.4356 / 7.1035

Source network: BELMANIP


Geostationary surface albedo (GSA) data


“+000”


“+057/+063”


Landcover information (based on ESA CCI landcover data)


Landcover fractions @ 2km distance


Landcover fractions @ 20 km distance


Legend


Distance to open water bodies [km]:

20.58

Distance to urban areas [km]:

27.55


Radius: 1 km

Number of landcover classes:

1

Dominant landcover type:

62: Tree cover, broadleaved, decidous (open 15-40%)

Fraction of dominant landcover type [%]:

100.0


Radius: 2 km

Number of landcover classes:

1

Dominant landcover type:

62: Tree cover, broadleaved, decidous (open 15-40%)

Fraction of dominant landcover type [%]:

100.0


Radius: 5 km

Number of landcover classes:

1

Dominant landcover type:

62: Tree cover, broadleaved, decidous (open 15-40%)

Fraction of dominant landcover type [%]:

100.0


Radius: 10 km

Number of landcover classes:

2

Dominant landcover type:

62: Tree cover, broadleaved, decidous (open 15-40%)

Fraction of dominant landcover type [%]:

95.0


Radius: 20 km

Number of landcover classes:

2

Dominant landcover type:

62: Tree cover, broadleaved, decidous (open 15-40%)

Fraction of dominant landcover type [%]:

92.0


Disturbances


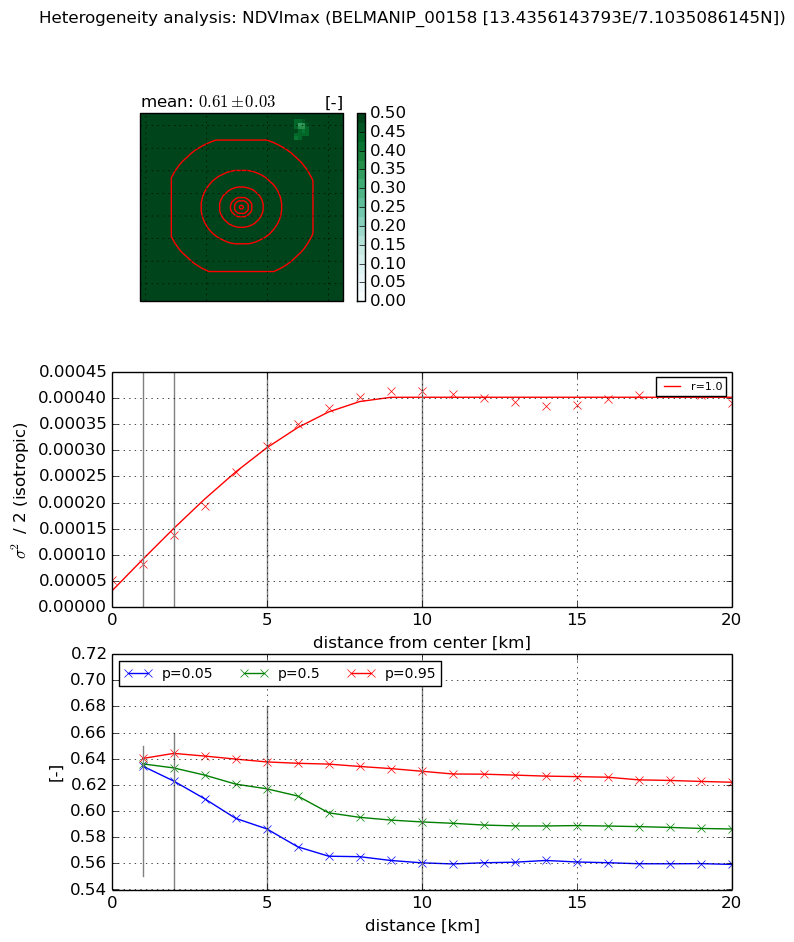
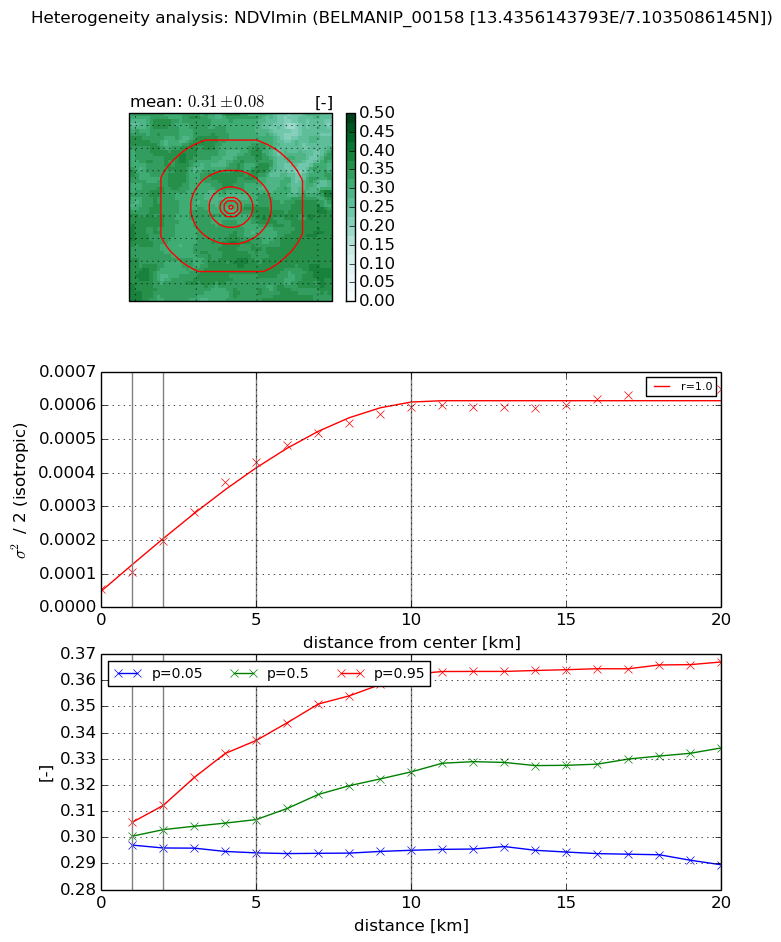
Heterogeneity analysis

The heterogeneity analysis provides information about the spatial and temporal heterogeneity of the site.

Topography


Roman et al. (2009) index


St

9.86692392613

Rcv

0.127660926872

Rse

0.0

Rst

0.000113537890438

Rsv

-0.176271661717


Height range @ 1km [m]

28

Height range @ 2km [m]

54

Height range @ 5km [m]

89

Height range @ 10km [m]

-999

Height range @ 20km [m]

-999


Variance slope @ 1 km

317

Variance slope @ 2 km

295

Variance slope @ 5 km

170

Variance slope @ 10 km

-999

Variance slope @ 20 km

-999


NDVI (max. NDVI composite)


Roman et al. (2009) index


St

2.07510432129

Rcv

0.703266928761

Rse

0.0

Rst

-0.123925291229

Rsv

0.618518228986


NDVI range @ 1km [-]

0.01

NDVI range @ 2km [-]

0.02

NDVI range @ 5km [-]

0.05

NDVI range @ 10km [-]

0.07

NDVI range @ 20km [-]

0.06


Variance slope @ 1 km

3.04485314862e-05

Variance slope @ 2 km

4.2597399269e-05

Variance slope @ 5 km

5.31640883356e-05

Variance slope @ 10 km

3.99221831233e-05

Variance slope @ 20 km

1.47545980937e-05


NDVI (min. NDVI composite)I


Roman et al. (2009) index


St

2.40720802999

Rcv

0.636004598582

Rse

0.0

Rst

-0.31719860826

Rsv

-0.293053852216


NDVI range @ 1km [-]

0.01

NDVI range @ 2km [-]

0.02

NDVI range @ 5km [-]

0.04

NDVI range @ 10km [-]

0.07

NDVI range @ 20km [-]

0.08


NDVI slope @ 1 km

5.20016760975e-05

NDVI slope @ 2 km

7.18530230683e-05

NDVI slope @ 5 km

7.90481891534e-05

NDVI slope @ 10 km

5.64855202286e-05

NDVI slope @ 20 km

2.58388668478e-05


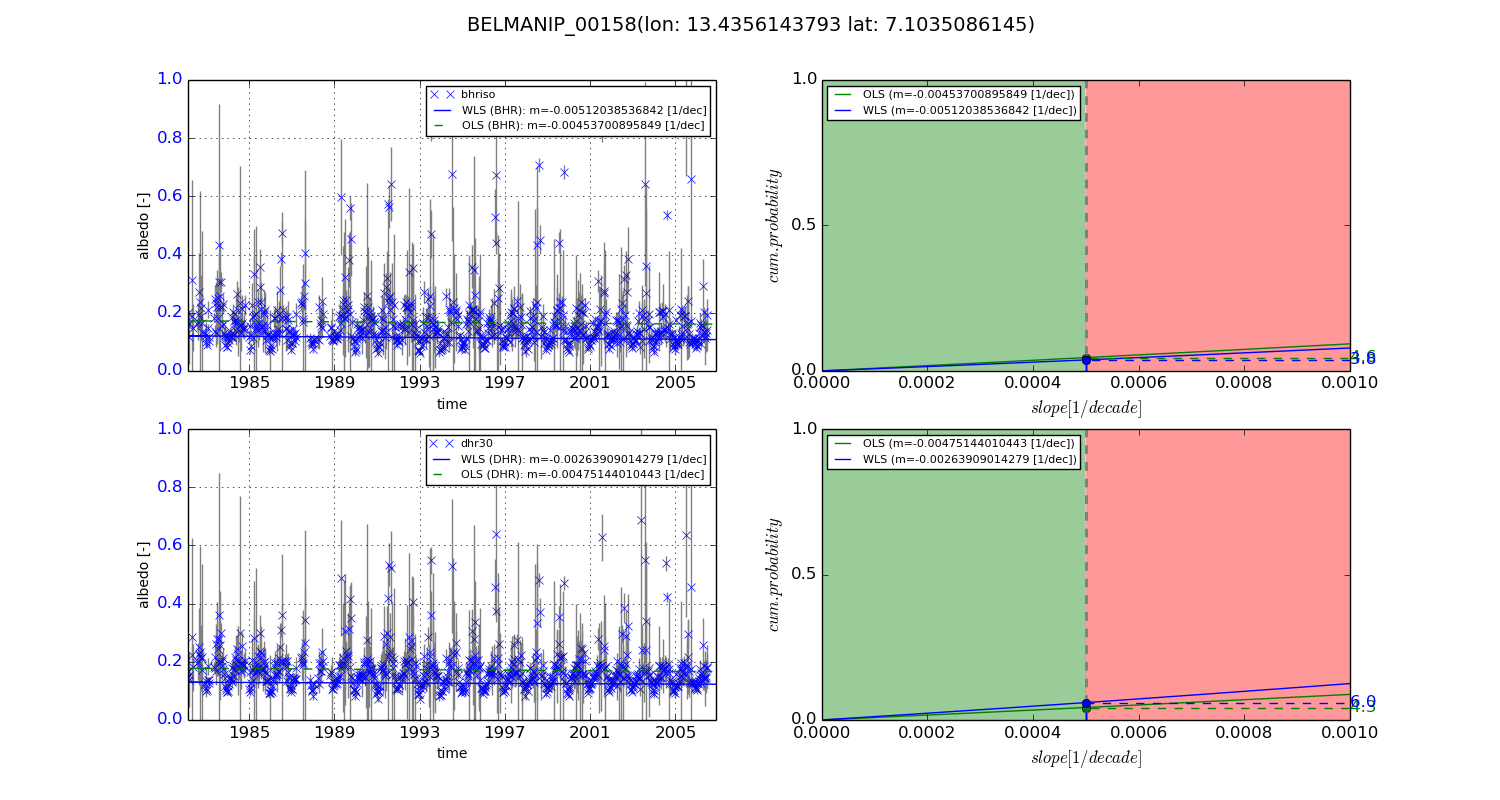
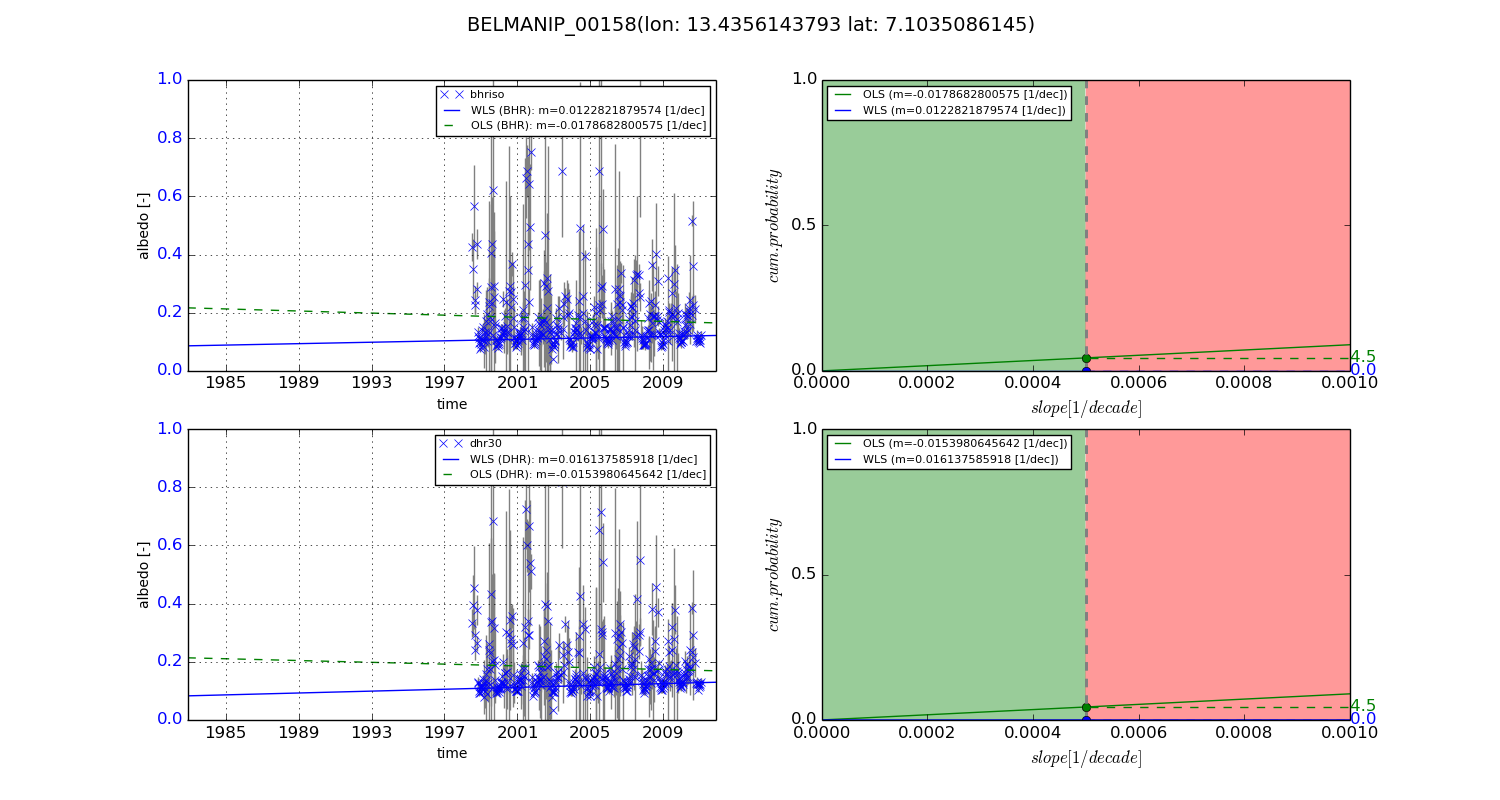
Temporal stability analysis

+000 deg (BHR)


BHR statistics

Temporal stability [1/decade]:


abs

rel


Weighted least square:

-0.00512038536842


Ordinary least square:

-0.00453700895849


Probabilities that GCOS criteria is met:

Weighted least square:

3.8 %

Ordinary least square:

4.6 %


DHR statistics

Temporal stability [1/decade]:


abs

rel


Weighted least square:

-0.00263909014279


Ordinary least square:

-0.00475144010443


Probabilities that GCOS criteria is met:

Weighted least square:

6.0 %

Ordinary least square:

4.3 %


+057/+063 deg (BHR)


BHR statistics

Temporal stability [1/decade]:


abs

rel


Weighted least square:

0.0122821879574


Ordinary least square:

-0.0178682800575


Probabilities that GCOS criteria is met:

Weighted least square:

0.0 %

Ordinary least square:

4.5 %


DHR statistics

Temporal stability [1/decade]:


abs

rel


Weighted least square:

0.016137585918


Ordinary least square:

-0.0153980645642


Probabilities that GCOS criteria is met:

Weighted least square:

0.0 %

Ordinary least square:

4.5 %


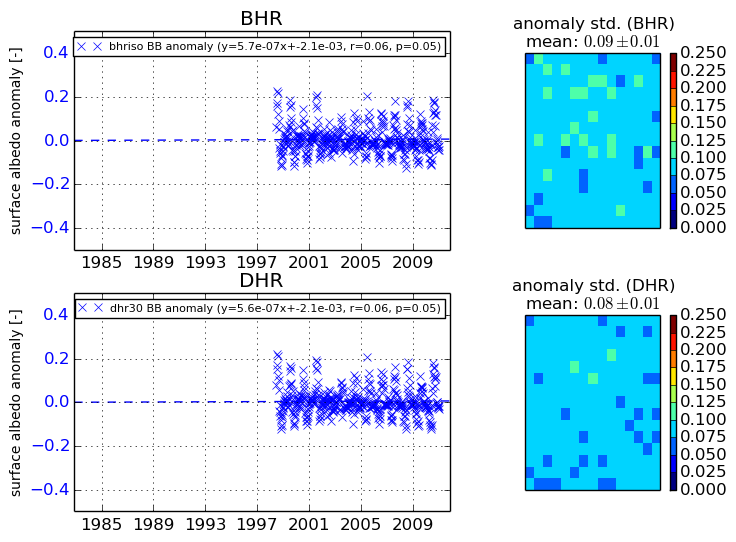
Temporal anomaly analyis

The variance of the temporal anomalies provides an additional measure about the stability of the signal AFTER removal of the mean seasonal cylce.
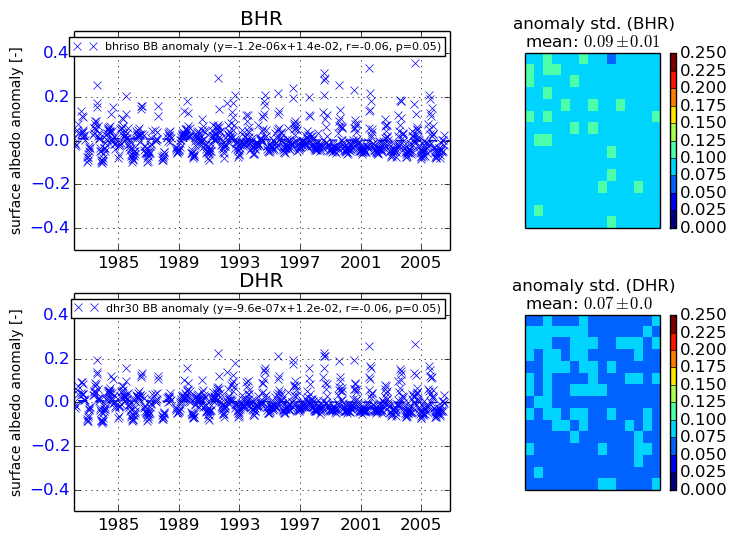
+000 deg


+057/+063 deg