BELMANIP_00163


Location

lon / lat [deg]: 4.3217 / 8.2771

Source network: BELMANIP


Geostationary surface albedo (GSA) data


“+000”


“+057/+063”


Landcover information (based on ESA CCI landcover data)


Landcover fractions @ 2km distance


Landcover fractions @ 20 km distance


Legend


Distance to open water bodies [km]:

16.8

Distance to urban areas [km]:

1.32


Radius: 1 km

Number of landcover classes:

4

Dominant landcover type:

120: Shrubland

Fraction of dominant landcover type [%]:

64.0


Radius: 2 km

Number of landcover classes:

6

Dominant landcover type:

40: mosaic natural vegetation (tree, shrub, herbaceous cover) (>50%) / cropland (<50%)

Fraction of dominant landcover type [%]:

44.0


Radius: 5 km

Number of landcover classes:

6

Dominant landcover type:

120: Shrubland

Fraction of dominant landcover type [%]:

39.0


Radius: 10 km

Number of landcover classes:

5

Dominant landcover type:

120: Shrubland

Fraction of dominant landcover type [%]:

42.0


Radius: 20 km

Number of landcover classes:

7

Dominant landcover type:

40: mosaic natural vegetation (tree, shrub, herbaceous cover) (>50%) / cropland (<50%)

Fraction of dominant landcover type [%]:

35.0


Disturbances


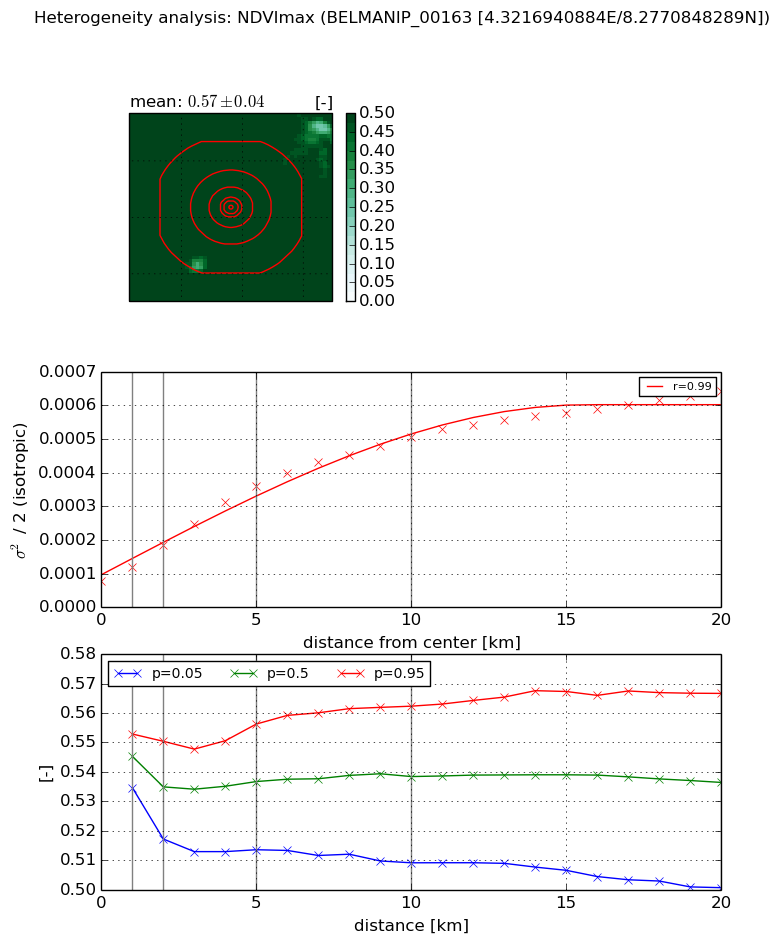
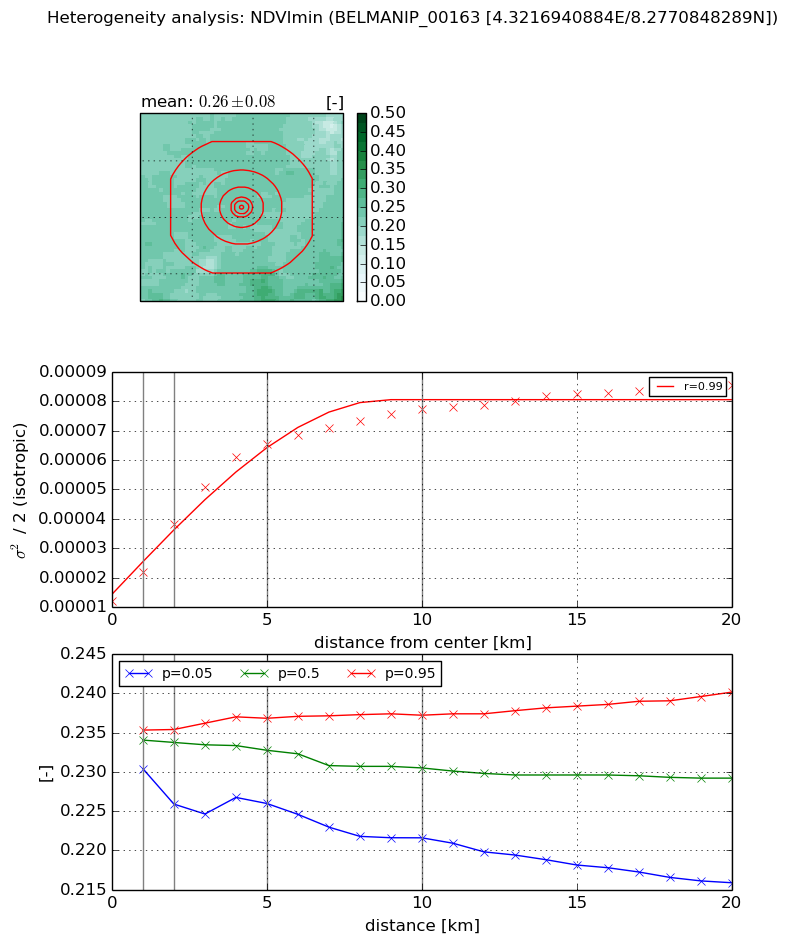
Heterogeneity analysis

The heterogeneity analysis provides information about the spatial and temporal heterogeneity of the site.

Topography


Roman et al. (2009) index


St

2.19902597975

Rcv

0.1181466449

Rse

0.0

Rst

-0.119194147721

Rsv

1.12689956999


Height range @ 1km [m]

28

Height range @ 2km [m]

43

Height range @ 5km [m]

51

Height range @ 10km [m]

-999

Height range @ 20km [m]

-999


Variance slope @ 1 km

129

Variance slope @ 2 km

90

Variance slope @ 5 km

65

Variance slope @ 10 km

-999

Variance slope @ 20 km

-999


NDVI (max. NDVI composite)


Roman et al. (2009) index


St

1.5702140343

Rcv

0.25113187158

Rse

0.0

Rst

-0.318245399435

Rsv

1.34119029141


NDVI range @ 1km [-]

0.02

NDVI range @ 2km [-]

0.03

NDVI range @ 5km [-]

0.04

NDVI range @ 10km [-]

0.05

NDVI range @ 20km [-]

0.07


Variance slope @ 1 km

4.03890608251e-05

Variance slope @ 2 km

5.36023472997e-05

Variance slope @ 5 km

5.87258199558e-05

Variance slope @ 10 km

4.40947158267e-05

Variance slope @ 20 km

2.62382749112e-05


NDVI (min. NDVI composite)I


Roman et al. (2009) index


St

37.3122790067

Rcv

-0.0588301763188

Rse

0.0

Rst

-0.0139815968187

Rsv

-0.00759071311813


NDVI range @ 1km [-]

0.0

NDVI range @ 2km [-]

0.01

NDVI range @ 5km [-]

0.01

NDVI range @ 10km [-]

0.02

NDVI range @ 20km [-]

0.02


NDVI slope @ 1 km

9.88200915049e-06

NDVI slope @ 2 km

1.29711690188e-05

NDVI slope @ 5 km

1.1318484317e-05

NDVI slope @ 10 km

6.3003211871e-06

NDVI slope @ 20 km

2.84452402288e-06


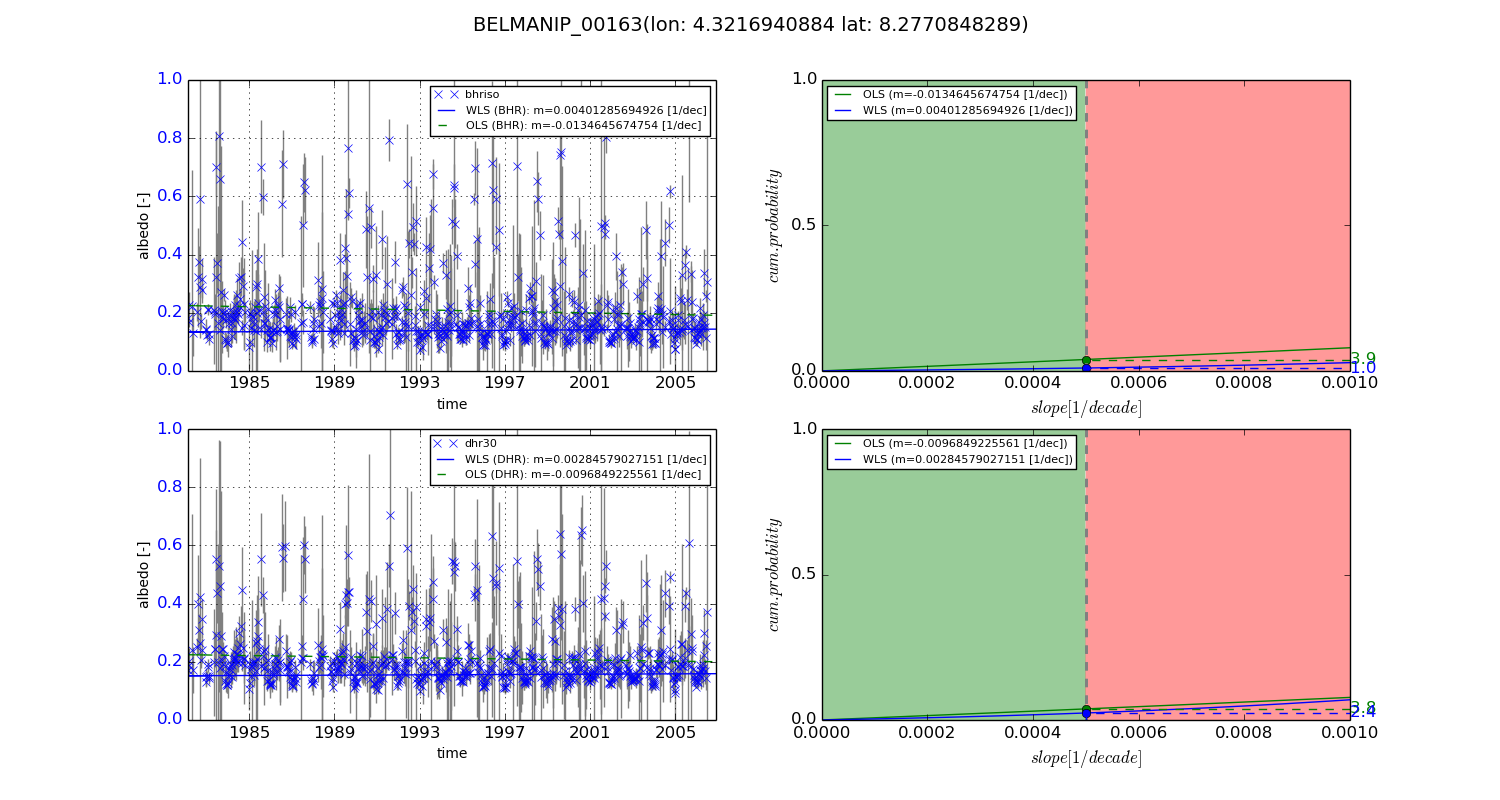
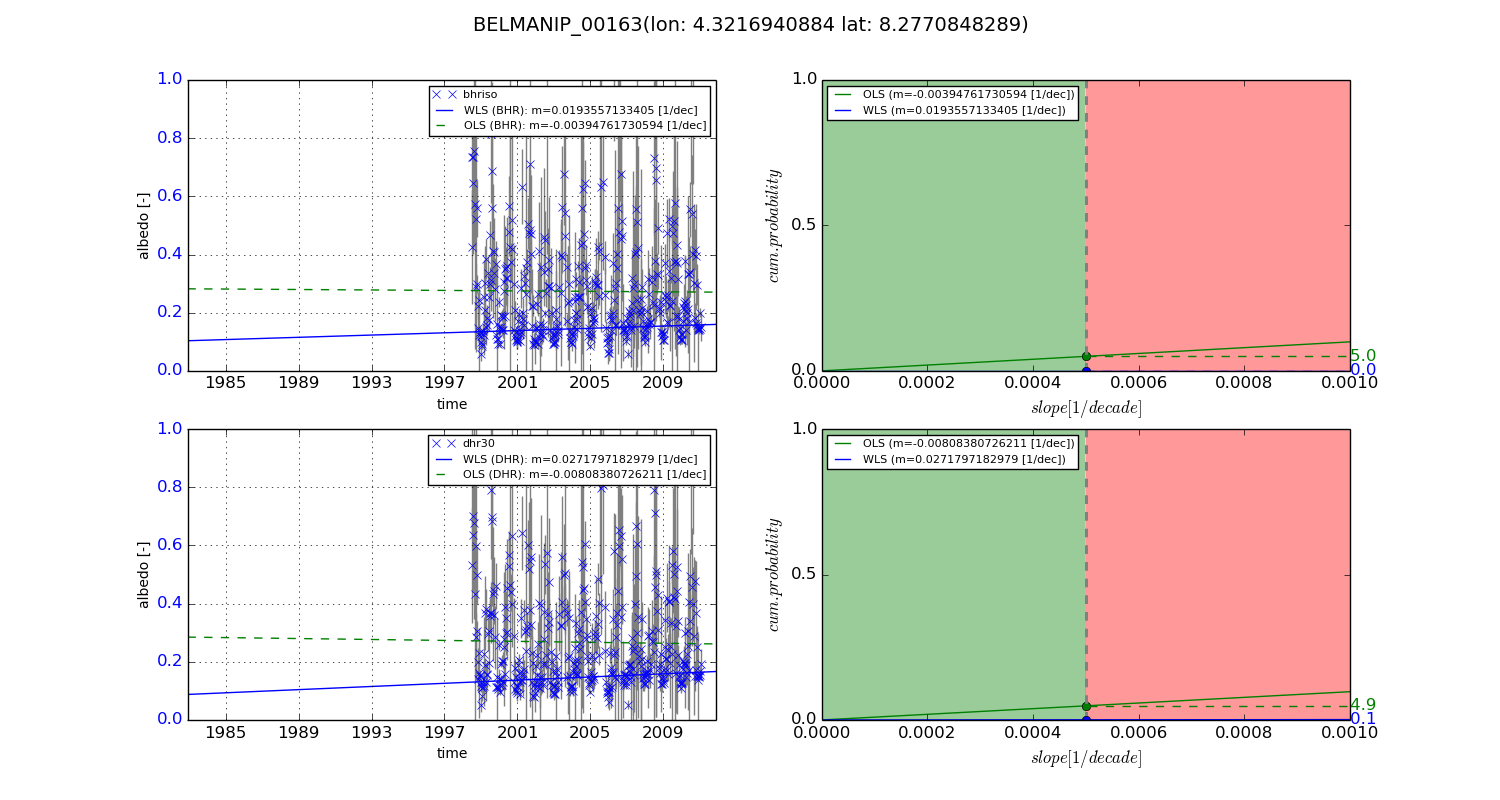
Temporal stability analysis

+000 deg (BHR)


BHR statistics

Temporal stability [1/decade]:


abs

rel


Weighted least square:

0.00401285694926


Ordinary least square:

-0.0134645674754


Probabilities that GCOS criteria is met:

Weighted least square:

1.0 %

Ordinary least square:

3.9 %


DHR statistics

Temporal stability [1/decade]:


abs

rel


Weighted least square:

0.00284579027151


Ordinary least square:

-0.0096849225561


Probabilities that GCOS criteria is met:

Weighted least square:

2.4 %

Ordinary least square:

3.8 %


+057/+063 deg (BHR)


BHR statistics

Temporal stability [1/decade]:


abs

rel


Weighted least square:

0.0193557133405


Ordinary least square:

-0.00394761730594


Probabilities that GCOS criteria is met:

Weighted least square:

0.0 %

Ordinary least square:

5.0 %


DHR statistics

Temporal stability [1/decade]:


abs

rel


Weighted least square:

0.0271797182979


Ordinary least square:

-0.00808380726211


Probabilities that GCOS criteria is met:

Weighted least square:

0.1 %

Ordinary least square:

4.9 %


Temporal anomaly analyis

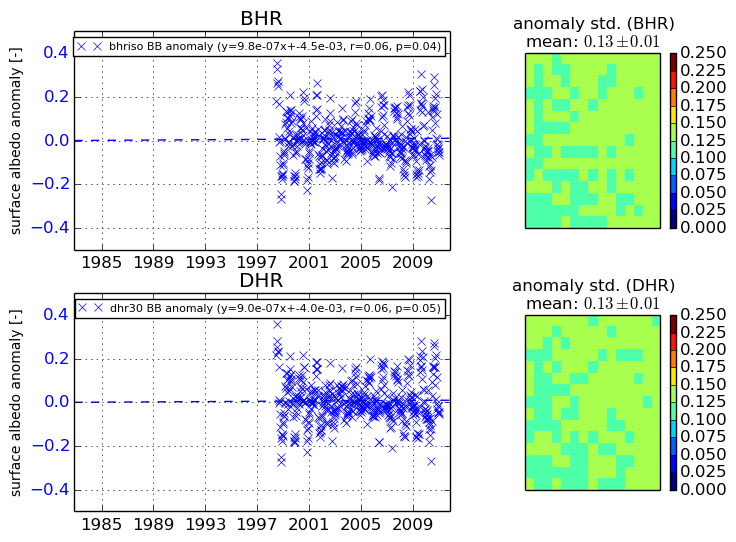
The variance of the temporal anomalies provides an additional measure about the stability of the signal AFTER removal of the mean seasonal cylce.
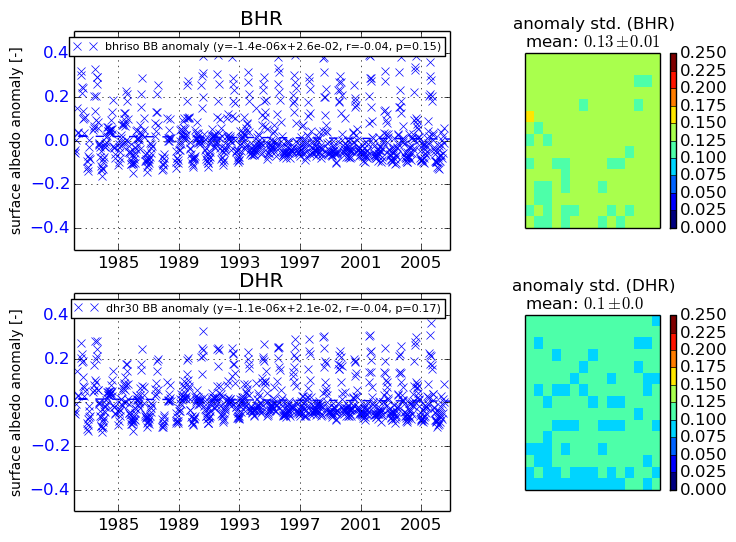
+000 deg


+057/+063 deg