BELMANIP_00167


Location

lon / lat [deg]: 41.2697 / 1.42

Source network: BELMANIP


Geostationary surface albedo (GSA) data


“+000”


“+057/+063”


Landcover information (based on ESA CCI landcover data)


Landcover fractions @ 2km distance


Landcover fractions @ 20 km distance


Legend


Distance to open water bodies [km]:

none in region

Distance to urban areas [km]:

12.07


Radius: 1 km

Number of landcover classes:

1

Dominant landcover type:

40: mosaic natural vegetation (tree, shrub, herbaceous cover) (>50%) / cropland (<50%)

Fraction of dominant landcover type [%]:

100.0


Radius: 2 km

Number of landcover classes:

4

Dominant landcover type:

40: mosaic natural vegetation (tree, shrub, herbaceous cover) (>50%) / cropland (<50%)

Fraction of dominant landcover type [%]:

84.0


Radius: 5 km

Number of landcover classes:

5

Dominant landcover type:

40: mosaic natural vegetation (tree, shrub, herbaceous cover) (>50%) / cropland (<50%)

Fraction of dominant landcover type [%]:

46.0


Radius: 10 km

Number of landcover classes:

5

Dominant landcover type:

120: Shrubland

Fraction of dominant landcover type [%]:

39.0


Radius: 20 km

Number of landcover classes:

5

Dominant landcover type:

40: mosaic natural vegetation (tree, shrub, herbaceous cover) (>50%) / cropland (<50%)

Fraction of dominant landcover type [%]:

38.0


Disturbances


Heterogeneity analysis

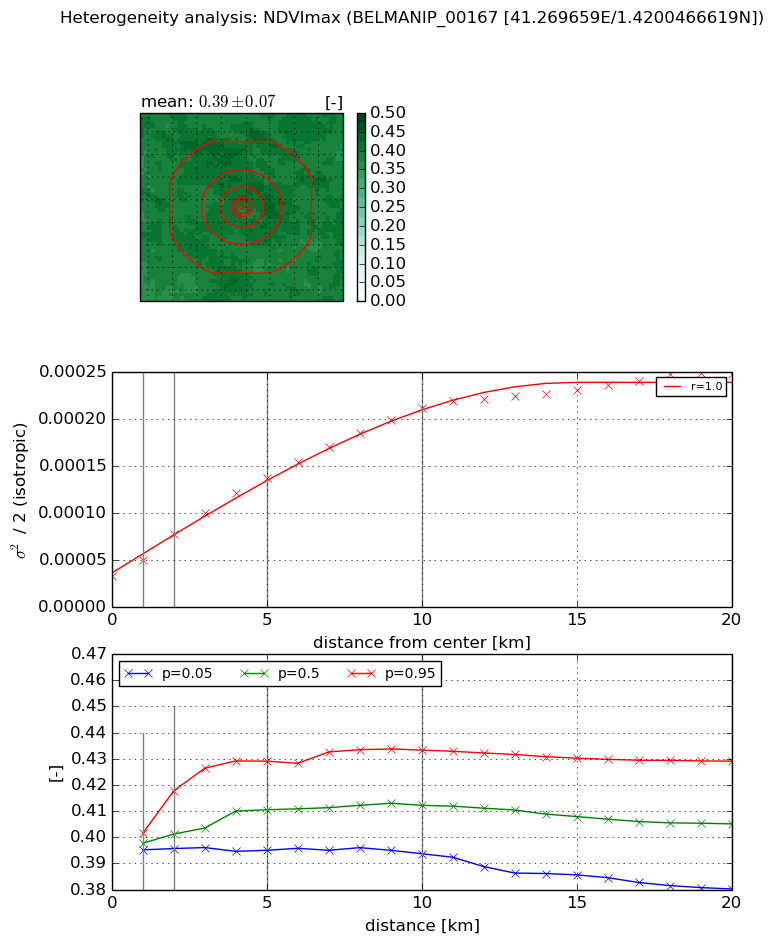
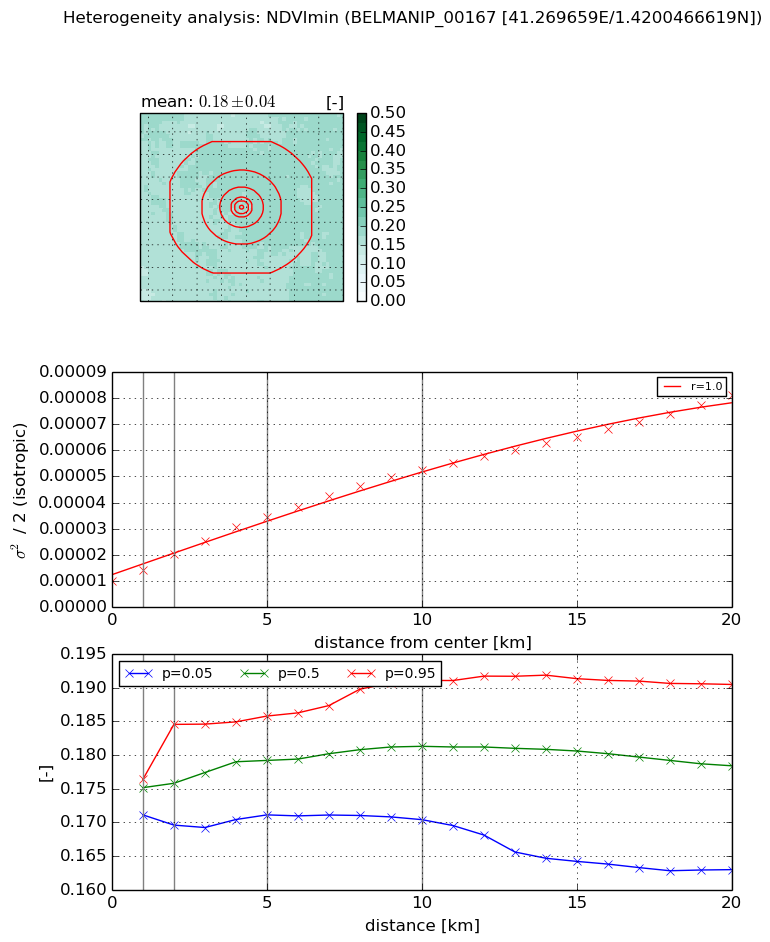
The heterogeneity analysis provides information about the spatial and temporal heterogeneity of the site.

Topography


Roman et al. (2009) index


St

1.55870966929

Rcv

0.516548185797

Rse

0.0

Rst

6.56397365806e-07

Rsv

1.40812004202


Height range @ 1km [m]

4

Height range @ 2km [m]

6

Height range @ 5km [m]

12

Height range @ 10km [m]

-999

Height range @ 20km [m]

-999


Variance slope @ 1 km

0

Variance slope @ 2 km

1

Variance slope @ 5 km

2

Variance slope @ 10 km

-999

Variance slope @ 20 km

-999


NDVI (max. NDVI composite)


Roman et al. (2009) index


St

1.43135743958e-07

Rcv

0.0169074221878

Rse

0.0

Rst

0.262024752456

Rsv

20959125.0732


NDVI range @ 1km [-]

0.01

NDVI range @ 2km [-]

0.02

NDVI range @ 5km [-]

0.03

NDVI range @ 10km [-]

0.04

NDVI range @ 20km [-]

0.05


Variance slope @ 1 km

1.76809230799e-05

Variance slope @ 2 km

2.25049528972e-05

Variance slope @ 5 km

2.15716029637e-05

Variance slope @ 10 km

1.80301705611e-05

Variance slope @ 20 km

1.03658623542e-05


NDVI (min. NDVI composite)I


Roman et al. (2009) index


St

3.35250484204

Rcv

-0.0909296513401

Rse

0.0

Rst

-0.379574231218

Rsv

0.424349411129


NDVI range @ 1km [-]

0.01

NDVI range @ 2km [-]

0.01

NDVI range @ 5km [-]

0.01

NDVI range @ 10km [-]

0.02

NDVI range @ 20km [-]

0.03


NDVI slope @ 1 km

4.17099740276e-06

NDVI slope @ 2 km

5.14280380047e-06

NDVI slope @ 5 km

5.03869346275e-06

NDVI slope @ 10 km

4.32567747375e-06

NDVI slope @ 20 km

3.36155500801e-06


Temporal stability analysis

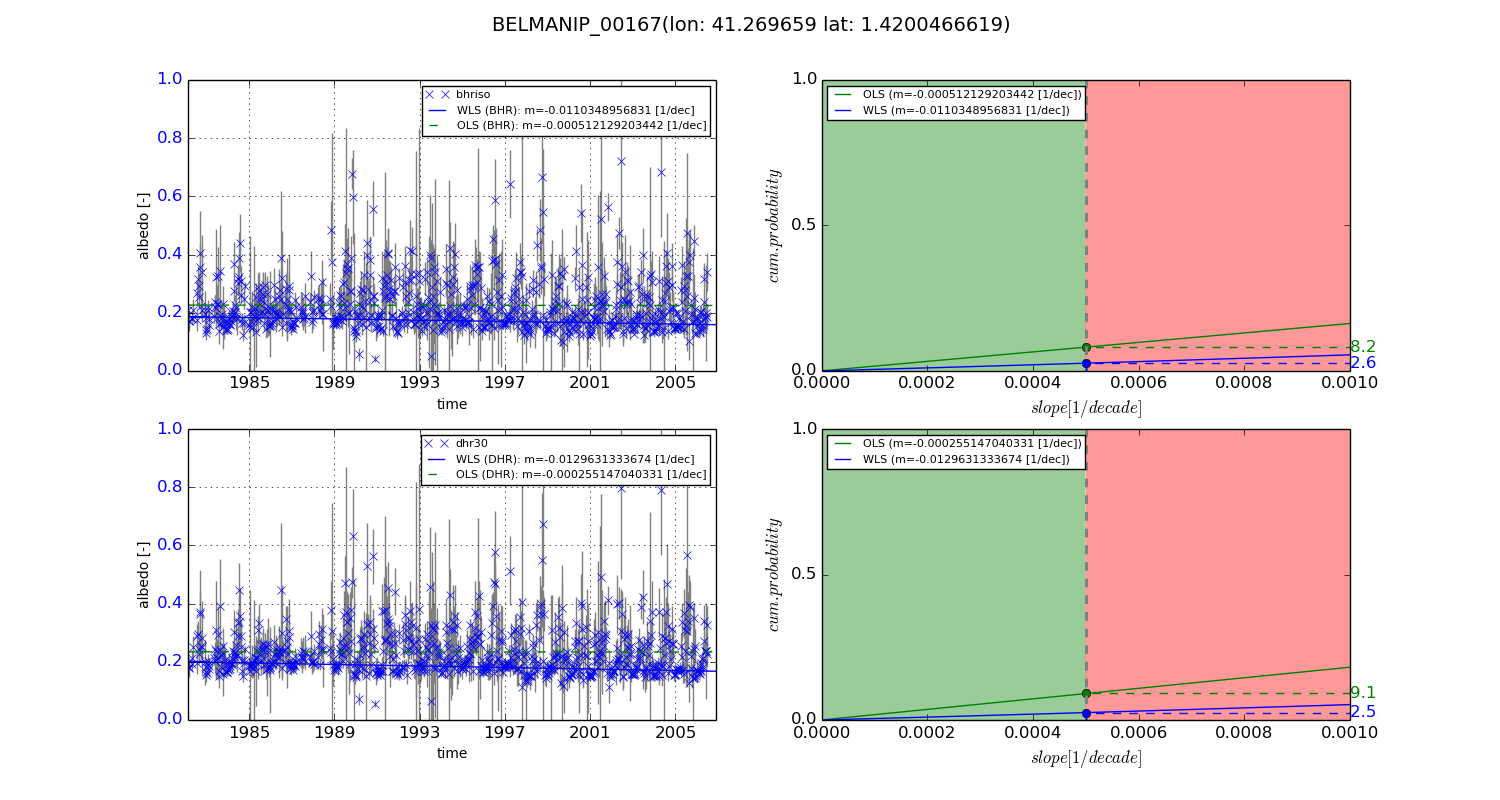
+000 deg (BHR)


BHR statistics

Temporal stability [1/decade]:


abs

rel


Weighted least square:

-0.0110348956831


Ordinary least square:

-0.000512129203442


Probabilities that GCOS criteria is met:

Weighted least square:

2.6 %

Ordinary least square:

8.2 %


DHR statistics

Temporal stability [1/decade]:


abs

rel


Weighted least square:

-0.0129631333674


Ordinary least square:

-0.000255147040331


Probabilities that GCOS criteria is met:

Weighted least square:

2.5 %

Ordinary least square:

9.1 %


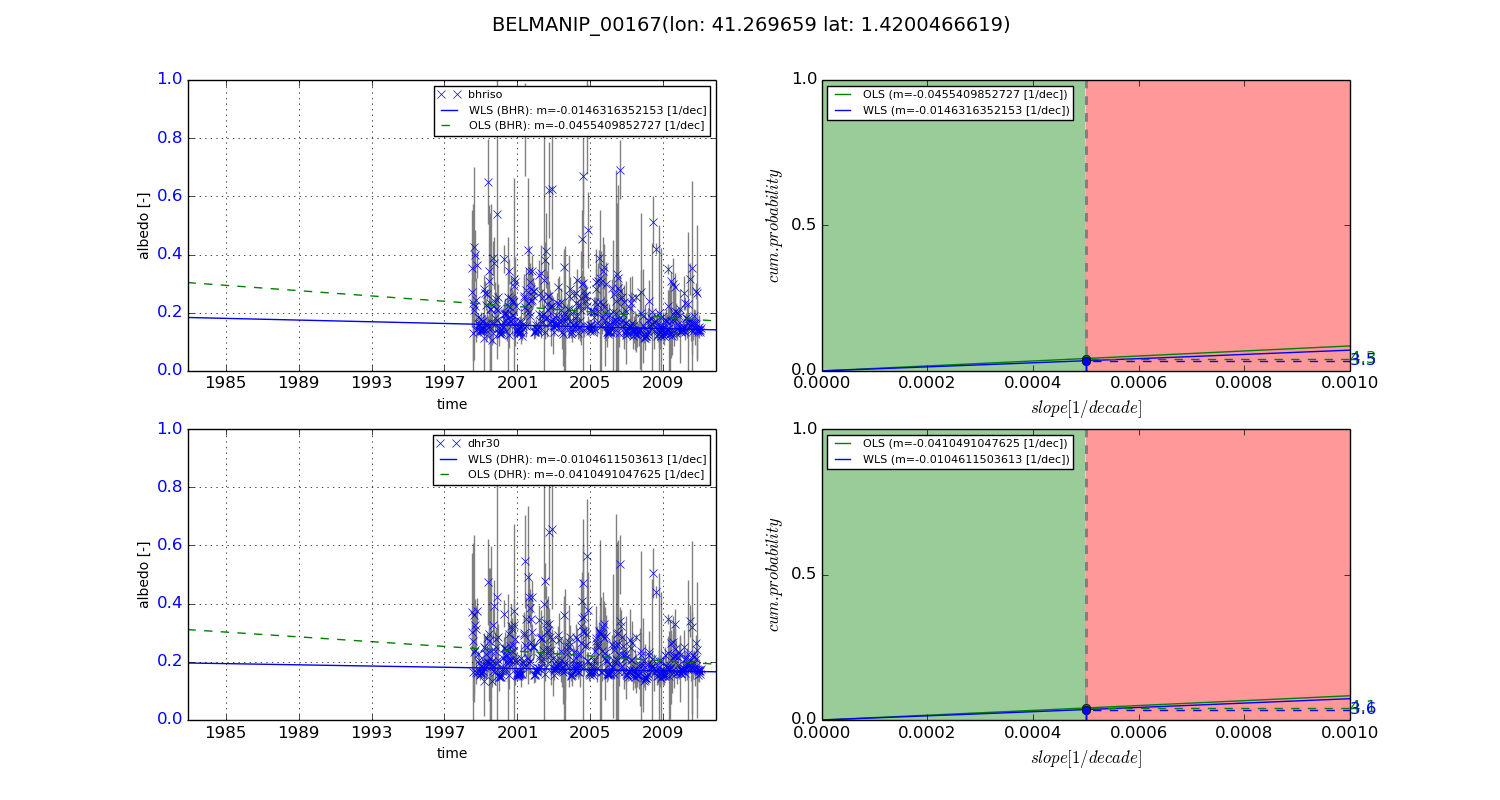
+057/+063 deg (BHR)


BHR statistics

Temporal stability [1/decade]:


abs

rel


Weighted least square:

-0.0146316352153


Ordinary least square:

-0.0455409852727


Probabilities that GCOS criteria is met:

Weighted least square:

3.5 %

Ordinary least square:

4.3 %


DHR statistics

Temporal stability [1/decade]:


abs

rel


Weighted least square:

-0.0104611503613


Ordinary least square:

-0.0410491047625


Probabilities that GCOS criteria is met:

Weighted least square:

3.6 %

Ordinary least square:

4.1 %


Temporal anomaly analyis

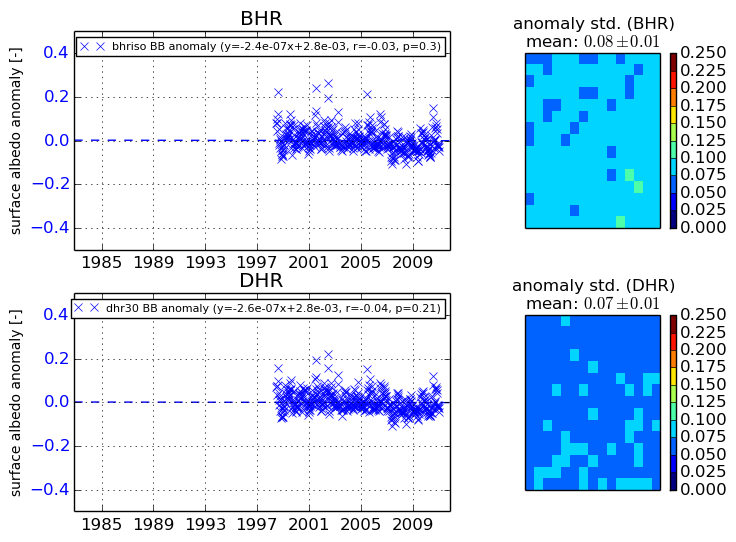
The variance of the temporal anomalies provides an additional measure about the stability of the signal AFTER removal of the mean seasonal cylce.
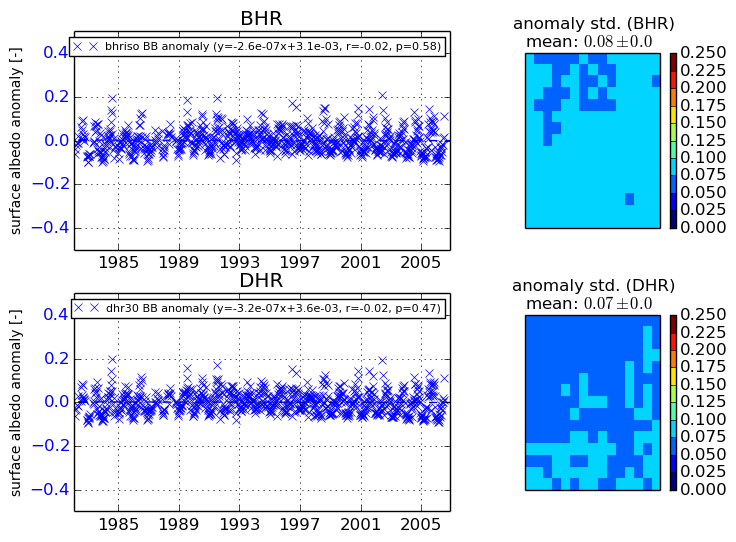
+000 deg


+057/+063 deg