BELMANIP_00170


Location

lon / lat [deg]: 39.6482 / 9.8027

Source network: BELMANIP


Geostationary surface albedo (GSA) data


“+000”


“+057/+063”


Landcover information (based on ESA CCI landcover data)


Landcover fractions @ 2km distance


Landcover fractions @ 20 km distance


Legend


Distance to open water bodies [km]:

50.36

Distance to urban areas [km]:

12.27


Radius: 1 km

Number of landcover classes:

2

Dominant landcover type:

10: cropland, rainfed

Fraction of dominant landcover type [%]:

94.0


Radius: 2 km

Number of landcover classes:

3

Dominant landcover type:

10: cropland, rainfed

Fraction of dominant landcover type [%]:

97.0


Radius: 5 km

Number of landcover classes:

2

Dominant landcover type:

10: cropland, rainfed

Fraction of dominant landcover type [%]:

94.0


Radius: 10 km

Number of landcover classes:

3

Dominant landcover type:

10: cropland, rainfed

Fraction of dominant landcover type [%]:

92.0


Radius: 20 km

Number of landcover classes:

5

Dominant landcover type:

10: cropland, rainfed

Fraction of dominant landcover type [%]:

88.0


Disturbances


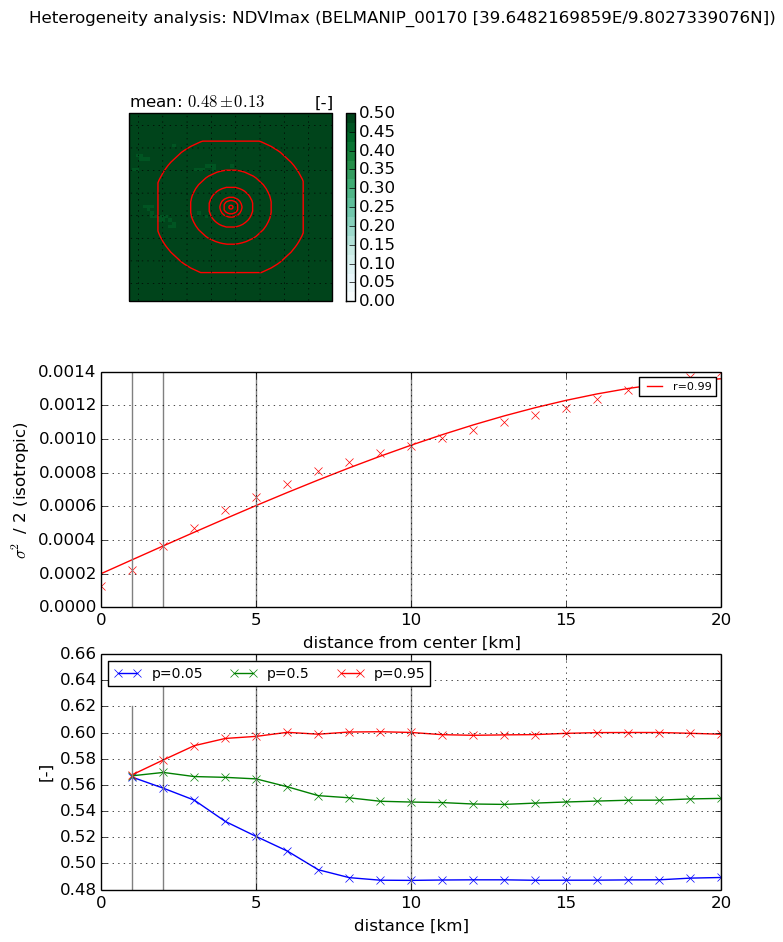
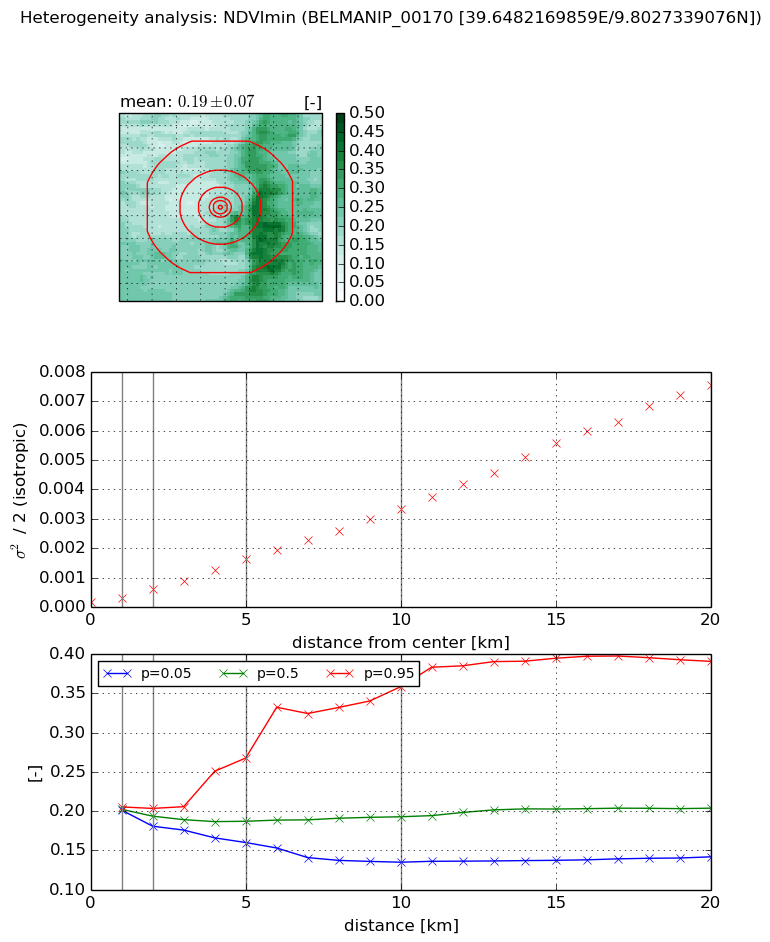
Heterogeneity analysis

The heterogeneity analysis provides information about the spatial and temporal heterogeneity of the site.

Topography


Roman et al. (2009) index


St

4.68997564765

Rcv

0.374052814976

Rse

0.0

Rst

-9.97604065278e-09

Rsv

0.265609345043


Height range @ 1km [m]

194

Height range @ 2km [m]

334

Height range @ 5km [m]

670

Height range @ 10km [m]

-999

Height range @ 20km [m]

-999


Variance slope @ 1 km

7470

Variance slope @ 2 km

7638

Variance slope @ 5 km

7915

Variance slope @ 10 km

-999

Variance slope @ 20 km

-999


NDVI (max. NDVI composite)


Roman et al. (2009) index


St

0.853209455193

Rcv

0.735708194823

Rse

0.0

Rst

5.62632957275e-09

Rsv

2.78042723586


NDVI range @ 1km [-]

0.0

NDVI range @ 2km [-]

0.02

NDVI range @ 5km [-]

0.08

NDVI range @ 10km [-]

0.11

NDVI range @ 20km [-]

0.11


Variance slope @ 1 km

9.21105787041e-05

Variance slope @ 2 km

0.000117175221105

Variance slope @ 5 km

0.000108956248881

Variance slope @ 10 km

8.45585977263e-05

Variance slope @ 20 km

6.00619899335e-05


NDVI (min. NDVI composite)I


Roman et al. (2009) index


St

0.729873765656

Rcv

2.72255804535

Rse

0.0

Rst

0.340316586126

Rsv

1.04742517811


NDVI range @ 1km [-]

0.0

NDVI range @ 2km [-]

0.02

NDVI range @ 5km [-]

0.11

NDVI range @ 10km [-]

0.22

NDVI range @ 20km [-]

0.25


NDVI slope @ 1 km

0.000155917117188

NDVI slope @ 2 km

0.000222881508962

NDVI slope @ 5 km

0.000297753287594

NDVI slope @ 10 km

0.000326513142199

NDVI slope @ 20 km

0.000383016917331


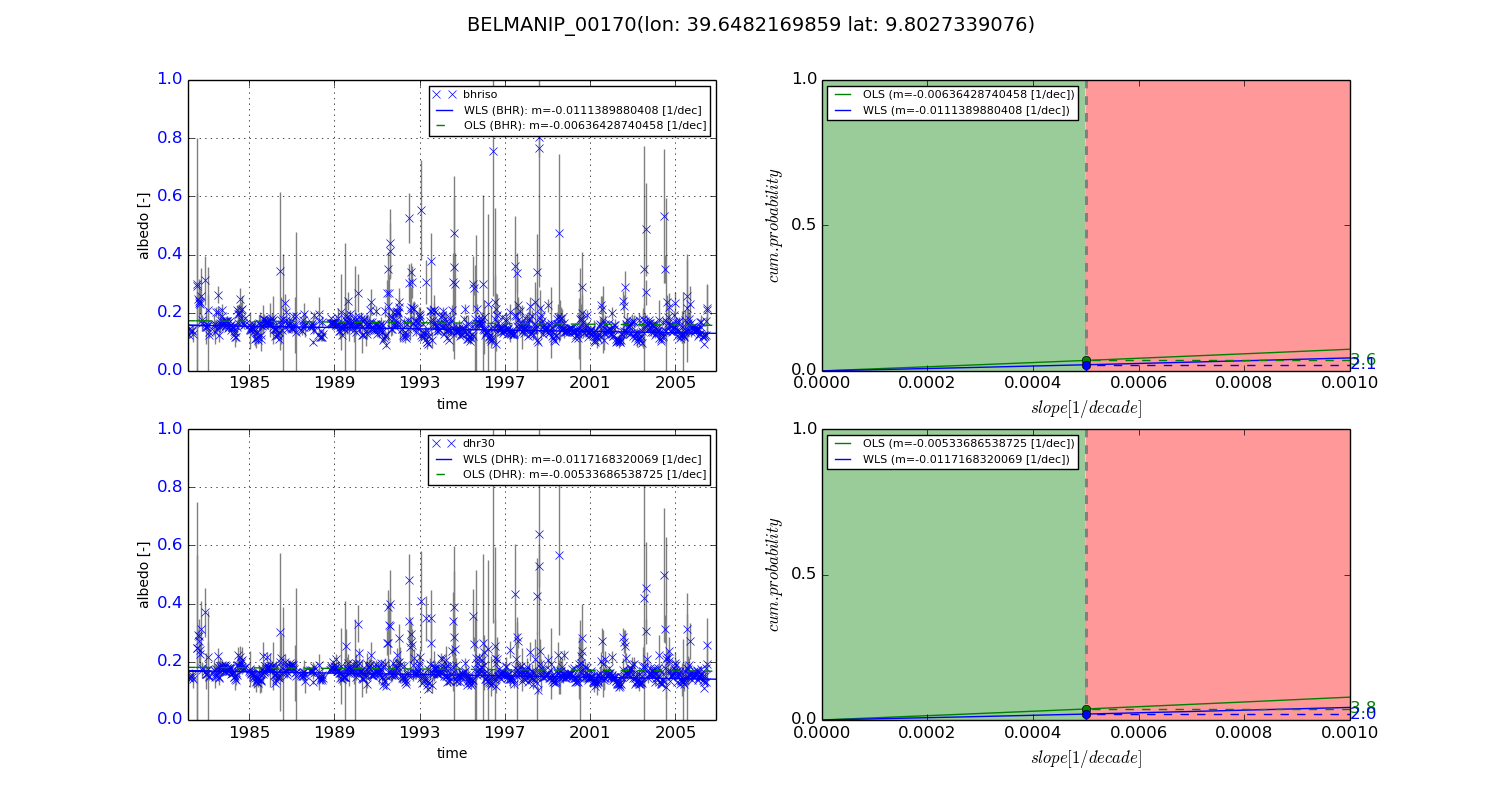
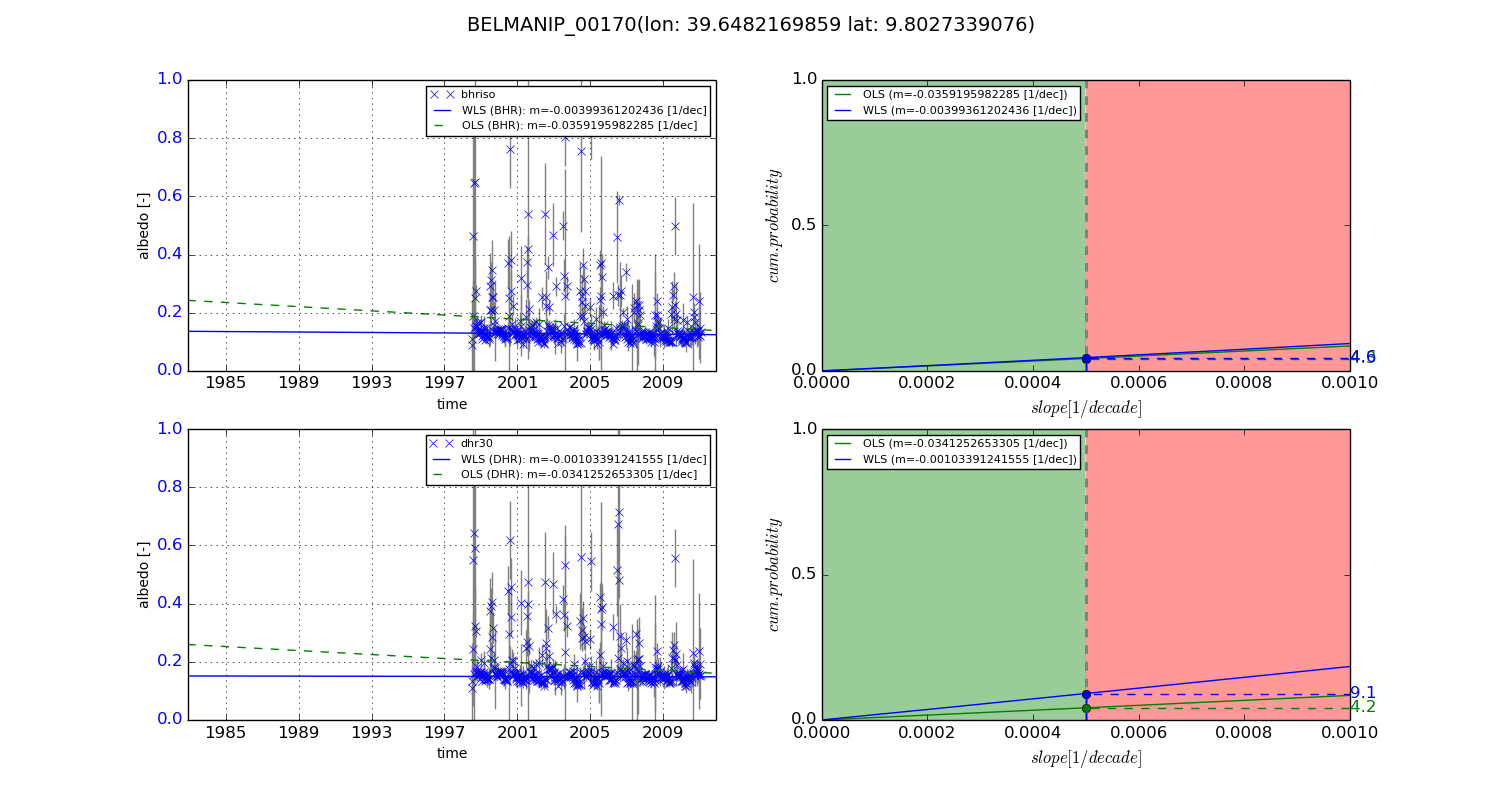
Temporal stability analysis

+000 deg (BHR)


BHR statistics

Temporal stability [1/decade]:


abs

rel


Weighted least square:

-0.0111389880408


Ordinary least square:

-0.00636428740458


Probabilities that GCOS criteria is met:

Weighted least square:

2.1 %

Ordinary least square:

3.6 %


DHR statistics

Temporal stability [1/decade]:


abs

rel


Weighted least square:

-0.0117168320069


Ordinary least square:

-0.00533686538725


Probabilities that GCOS criteria is met:

Weighted least square:

2.0 %

Ordinary least square:

3.8 %


+057/+063 deg (BHR)


BHR statistics

Temporal stability [1/decade]:


abs

rel


Weighted least square:

-0.00399361202436


Ordinary least square:

-0.0359195982285


Probabilities that GCOS criteria is met:

Weighted least square:

4.6 %

Ordinary least square:

4.3 %


DHR statistics

Temporal stability [1/decade]:


abs

rel


Weighted least square:

-0.00103391241555


Ordinary least square:

-0.0341252653305


Probabilities that GCOS criteria is met:

Weighted least square:

9.1 %

Ordinary least square:

4.2 %


Temporal anomaly analyis

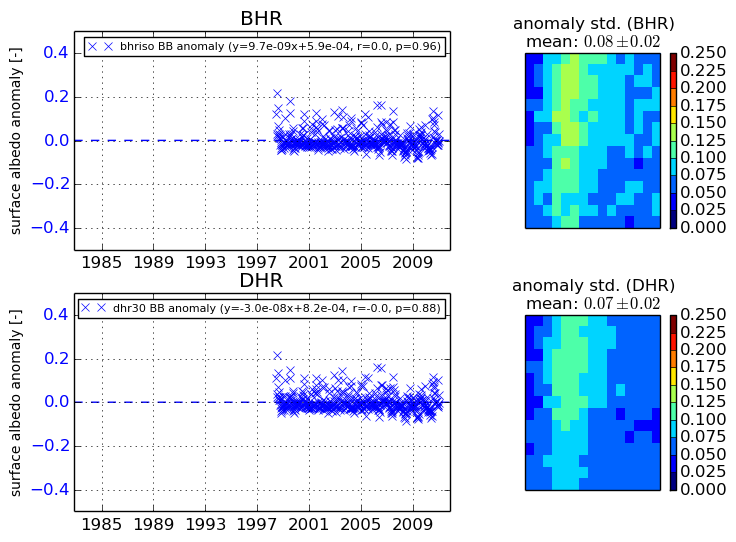
The variance of the temporal anomalies provides an additional measure about the stability of the signal AFTER removal of the mean seasonal cylce.
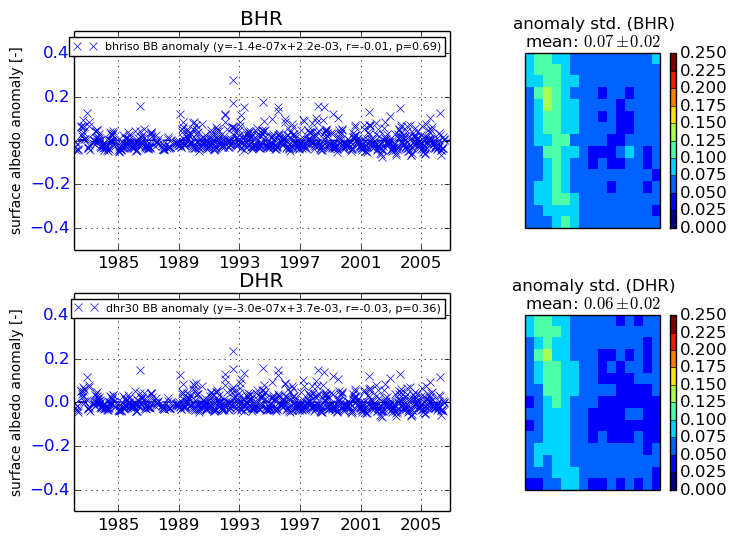
+000 deg


+057/+063 deg