BELMANIP_00171


Location

lon / lat [deg]: 34.0831 / 1.2524

Source network: BELMANIP


Geostationary surface albedo (GSA) data


“+000”


“+057/+063”


Landcover information (based on ESA CCI landcover data)


Landcover fractions @ 2km distance


Landcover fractions @ 20 km distance


Legend


Distance to open water bodies [km]:

35.57

Distance to urban areas [km]:

20.31


Radius: 1 km

Number of landcover classes:

2

Dominant landcover type:

10: cropland, rainfed

Fraction of dominant landcover type [%]:

66.0


Radius: 2 km

Number of landcover classes:

2

Dominant landcover type:

10: cropland, rainfed

Fraction of dominant landcover type [%]:

66.0


Radius: 5 km

Number of landcover classes:

2

Dominant landcover type:

10: cropland, rainfed

Fraction of dominant landcover type [%]:

80.0


Radius: 10 km

Number of landcover classes:

2

Dominant landcover type:

10: cropland, rainfed

Fraction of dominant landcover type [%]:

79.0


Radius: 20 km

Number of landcover classes:

3

Dominant landcover type:

10: cropland, rainfed

Fraction of dominant landcover type [%]:

82.0


Disturbances


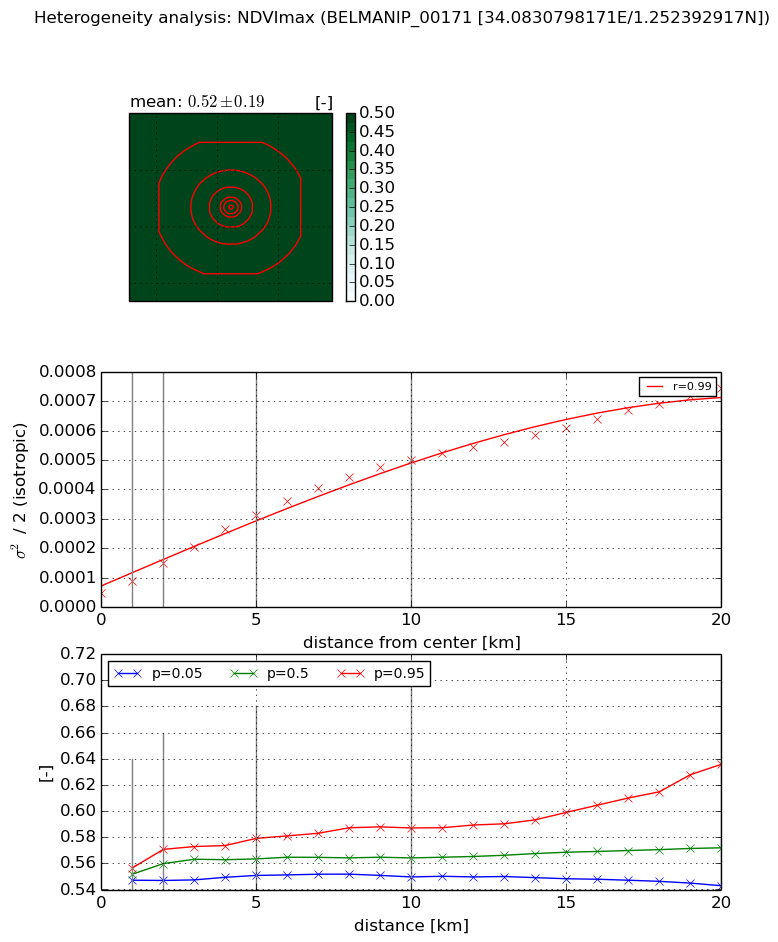
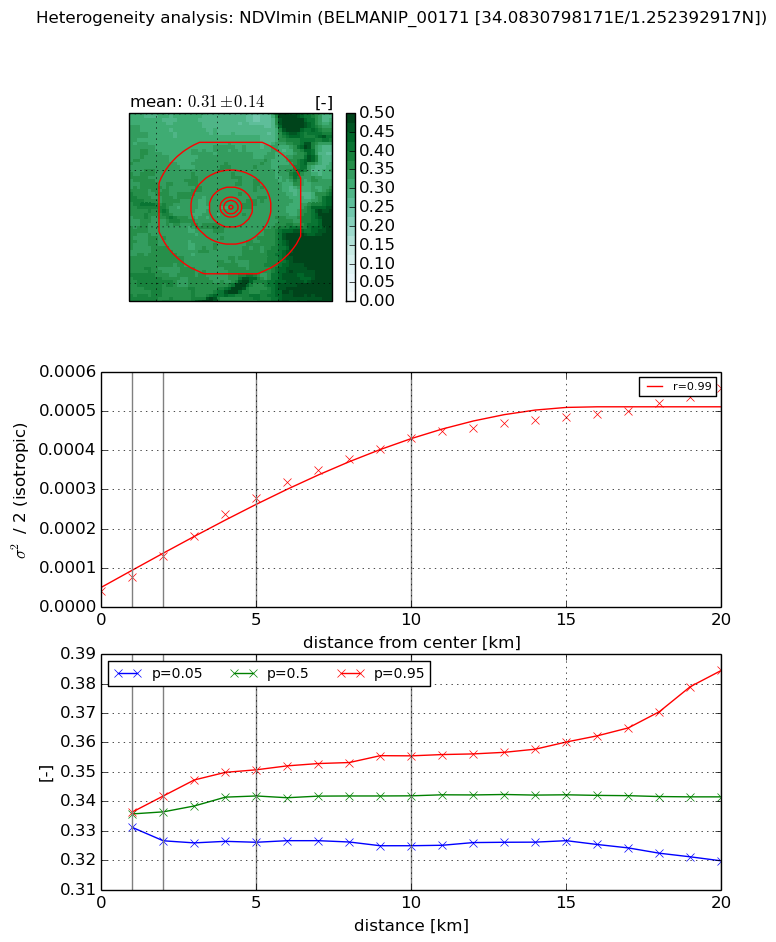
Heterogeneity analysis

The heterogeneity analysis provides information about the spatial and temporal heterogeneity of the site.

Topography


Roman et al. (2009) index


St

10.0868527246

Rcv

0.17725587692

Rse

0.0

Rst

-0.0229850993988

Rsv

0.0971758772732


Height range @ 1km [m]

29

Height range @ 2km [m]

36

Height range @ 5km [m]

47

Height range @ 10km [m]

-999

Height range @ 20km [m]

-999


Variance slope @ 1 km

90

Variance slope @ 2 km

90

Variance slope @ 5 km

53

Variance slope @ 10 km

-999

Variance slope @ 20 km

-999


NDVI (max. NDVI composite)


Roman et al. (2009) index


St

5.91972573591

Rcv

-0.00170090510185

Rse

0.0

Rst

-0.222468096753

Rsv

0.282611233216


NDVI range @ 1km [-]

0.01

NDVI range @ 2km [-]

0.02

NDVI range @ 5km [-]

0.03

NDVI range @ 10km [-]

0.04

NDVI range @ 20km [-]

0.09


Variance slope @ 1 km

3.85832512979e-05

Variance slope @ 2 km

5.11381541841e-05

Variance slope @ 5 km

5.47445877573e-05

Variance slope @ 10 km

4.70683797362e-05

Variance slope @ 20 km

3.3143170354e-05


NDVI (min. NDVI composite)I


Roman et al. (2009) index


St

4.24658373684

Rcv

0.104039718049

Rse

0.0

Rst

-0.308113656608

Rsv

0.294296841777


NDVI range @ 1km [-]

0.01

NDVI range @ 2km [-]

0.02

NDVI range @ 5km [-]

0.02

NDVI range @ 10km [-]

0.03

NDVI range @ 20km [-]

0.06


NDVI slope @ 1 km

3.39697786767e-05

NDVI slope @ 2 km

4.45740936581e-05

NDVI slope @ 5 km

4.89570845051e-05

NDVI slope @ 10 km

4.01461014858e-05

NDVI slope @ 20 km

2.39489958355e-05


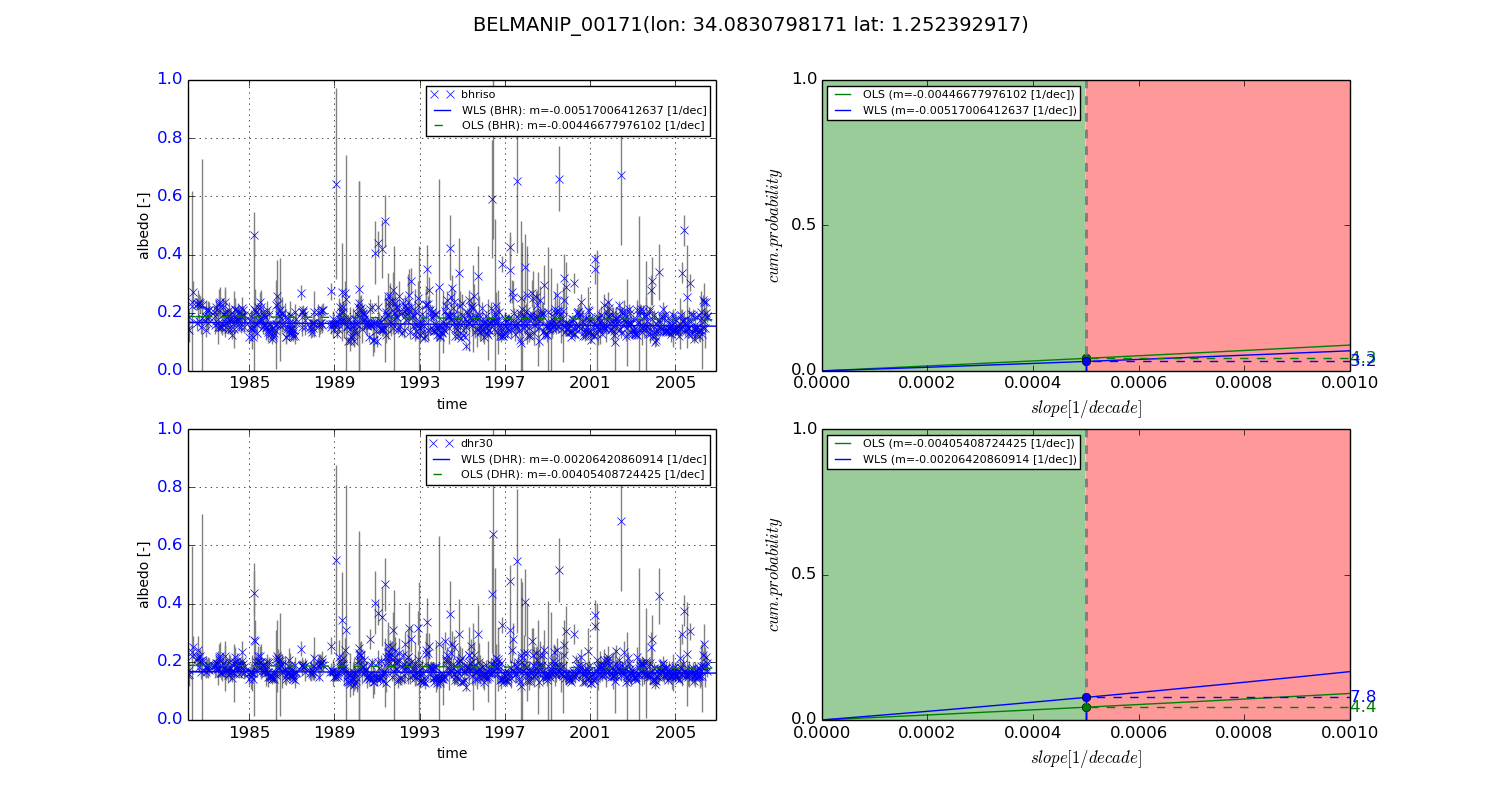
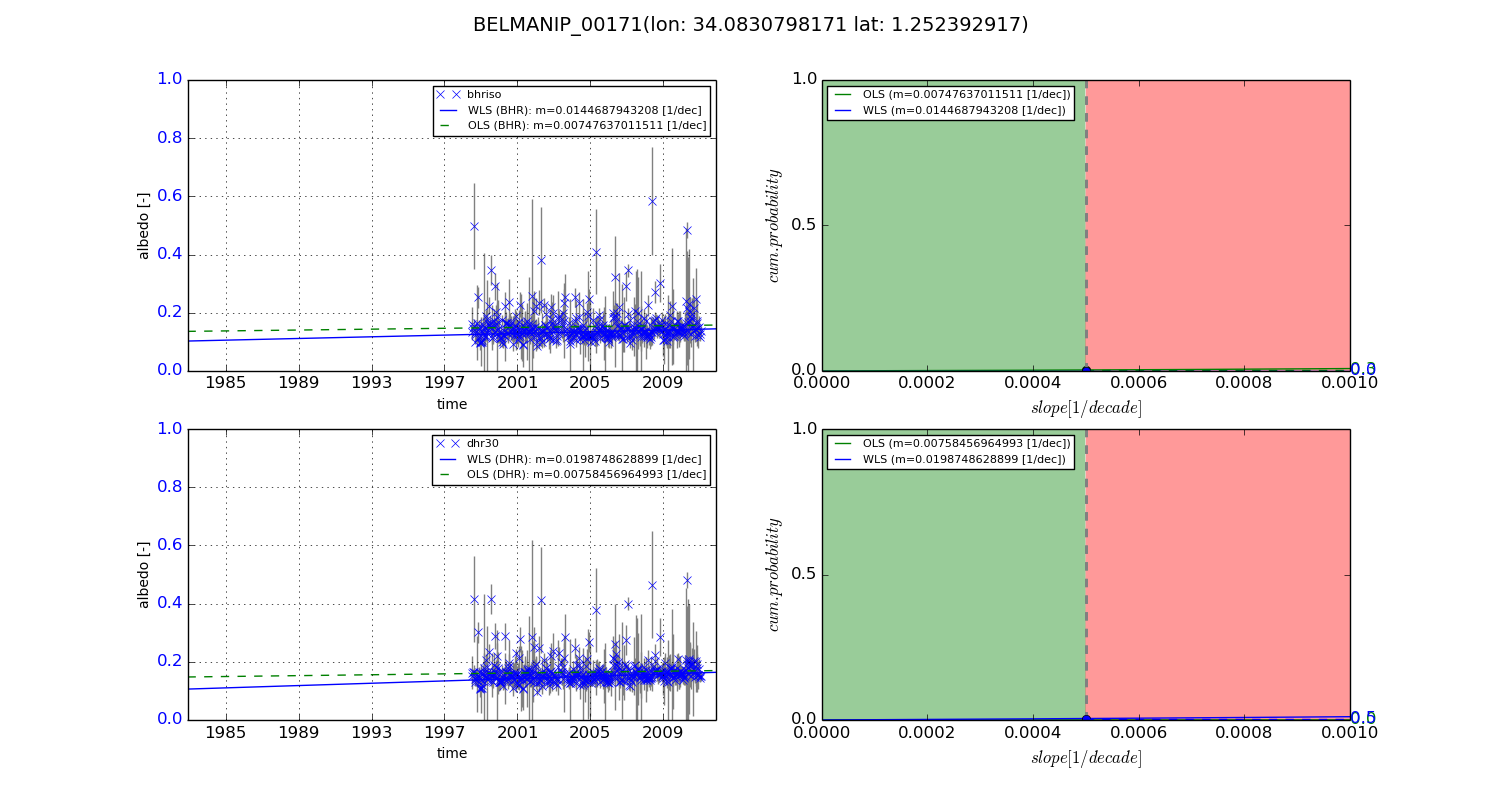
Temporal stability analysis

+000 deg (BHR)


BHR statistics

Temporal stability [1/decade]:


abs

rel


Weighted least square:

-0.00517006412637


Ordinary least square:

-0.00446677976102


Probabilities that GCOS criteria is met:

Weighted least square:

3.2 %

Ordinary least square:

4.3 %


DHR statistics

Temporal stability [1/decade]:


abs

rel


Weighted least square:

-0.00206420860914


Ordinary least square:

-0.00405408724425


Probabilities that GCOS criteria is met:

Weighted least square:

7.8 %

Ordinary least square:

4.4 %


+057/+063 deg (BHR)


BHR statistics

Temporal stability [1/decade]:


abs

rel


Weighted least square:

0.0144687943208


Ordinary least square:

0.00747637011511


Probabilities that GCOS criteria is met:

Weighted least square:

0.0 %

Ordinary least square:

0.3 %


DHR statistics

Temporal stability [1/decade]:


abs

rel


Weighted least square:

0.0198748628899


Ordinary least square:

0.00758456964993


Probabilities that GCOS criteria is met:

Weighted least square:

0.5 %

Ordinary least square:

0.0 %


Temporal anomaly analyis

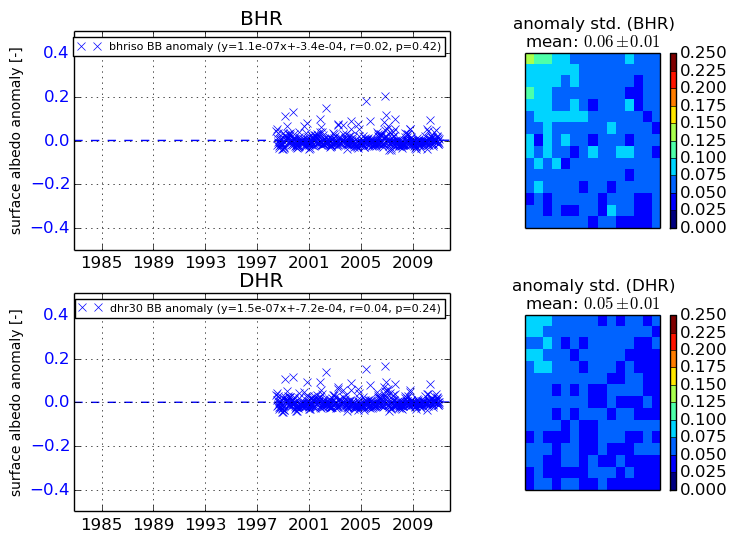
The variance of the temporal anomalies provides an additional measure about the stability of the signal AFTER removal of the mean seasonal cylce.
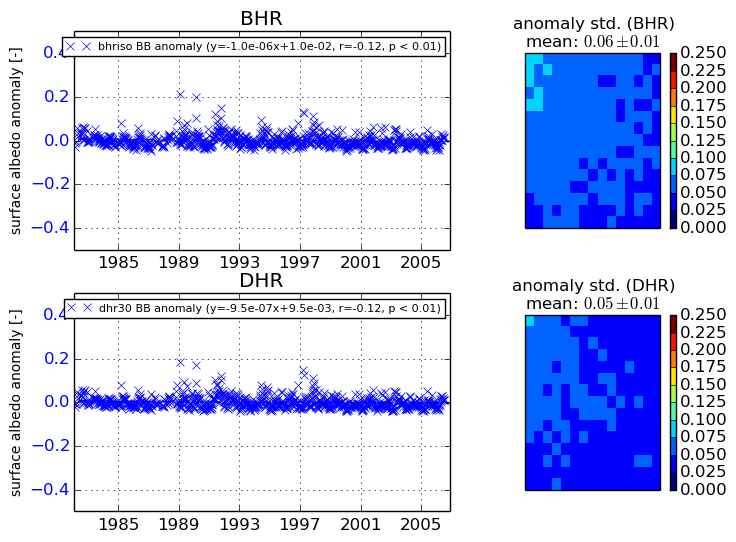
+000 deg


+057/+063 deg