BELMANIP_00172


Location

lon / lat [deg]: -11.1531 / 8.0927

Source network: BELMANIP


Geostationary surface albedo (GSA) data


“+000”


“+057/+063”


Landcover information (based on ESA CCI landcover data)


Landcover fractions @ 2km distance


Landcover fractions @ 20 km distance


Legend


Distance to open water bodies [km]:

17.7

Distance to urban areas [km]:

6.9


Radius: 1 km

Number of landcover classes:

2

Dominant landcover type:

10: cropland, rainfed

Fraction of dominant landcover type [%]:

82.0


Radius: 2 km

Number of landcover classes:

3

Dominant landcover type:

10: cropland, rainfed

Fraction of dominant landcover type [%]:

81.0


Radius: 5 km

Number of landcover classes:

4

Dominant landcover type:

10: cropland, rainfed

Fraction of dominant landcover type [%]:

72.0


Radius: 10 km

Number of landcover classes:

4

Dominant landcover type:

10: cropland, rainfed

Fraction of dominant landcover type [%]:

71.0


Radius: 20 km

Number of landcover classes:

5

Dominant landcover type:

10: cropland, rainfed

Fraction of dominant landcover type [%]:

66.0


Disturbances


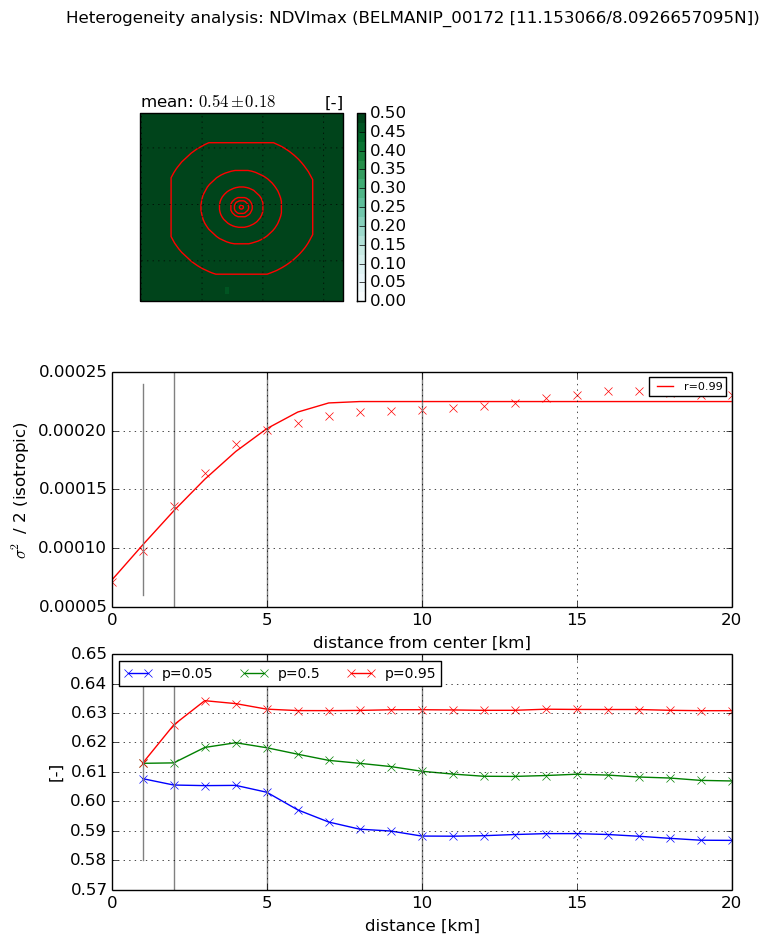
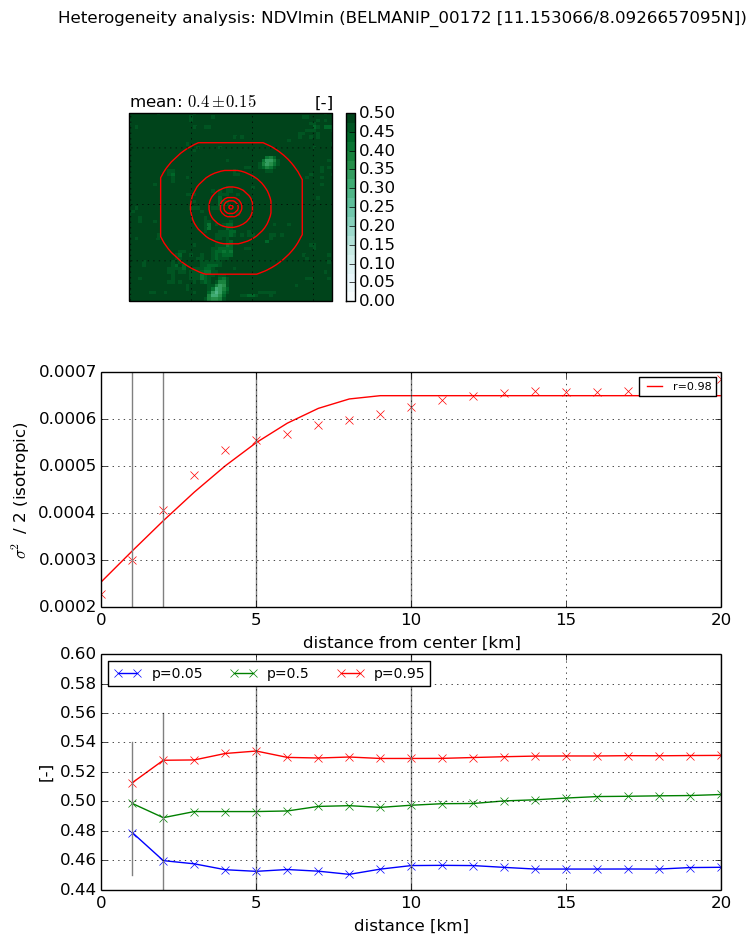
Heterogeneity analysis

The heterogeneity analysis provides information about the spatial and temporal heterogeneity of the site.

Topography


Roman et al. (2009) index


St

2.7855351936

Rcv

0.493528004627

Rse

0.0

Rst

-0.0307325644177

Rsv

0.552731747152


Height range @ 1km [m]

137

Height range @ 2km [m]

156

Height range @ 5km [m]

266

Height range @ 10km [m]

-999

Height range @ 20km [m]

-999


Variance slope @ 1 km

3183

Variance slope @ 2 km

2740

Variance slope @ 5 km

1055

Variance slope @ 10 km

-999

Variance slope @ 20 km

-999


NDVI (max. NDVI composite)


Roman et al. (2009) index


St

nan

Rcv

nan

Rse

nan

Rst

nan

Rsv

nan


NDVI range @ 1km [-]

0.01

NDVI range @ 2km [-]

0.02

NDVI range @ 5km [-]

0.03

NDVI range @ 10km [-]

0.04

NDVI range @ 20km [-]

0.04


Variance slope @ 1 km

2.64663945828e-05

Variance slope @ 2 km

3.25946237897e-05

Variance slope @ 5 km

2.70686349281e-05

Variance slope @ 10 km

1.42152605055e-05

Variance slope @ 20 km

5.97084179823e-06


NDVI (min. NDVI composite)I


Roman et al. (2009) index


St

1.91872145748

Rcv

0.062309657618

Rse

0.0

Rst

-0.299407207715

Rsv

1.20182430856


NDVI range @ 1km [-]

0.03

NDVI range @ 2km [-]

0.07

NDVI range @ 5km [-]

0.08

NDVI range @ 10km [-]

0.07

NDVI range @ 20km [-]

0.08


NDVI slope @ 1 km

7.29885745466e-05

NDVI slope @ 2 km

8.97081970541e-05

NDVI slope @ 5 km

6.90328227876e-05

NDVI slope @ 10 km

3.68373012895e-05

NDVI slope @ 20 km

1.71727760173e-05


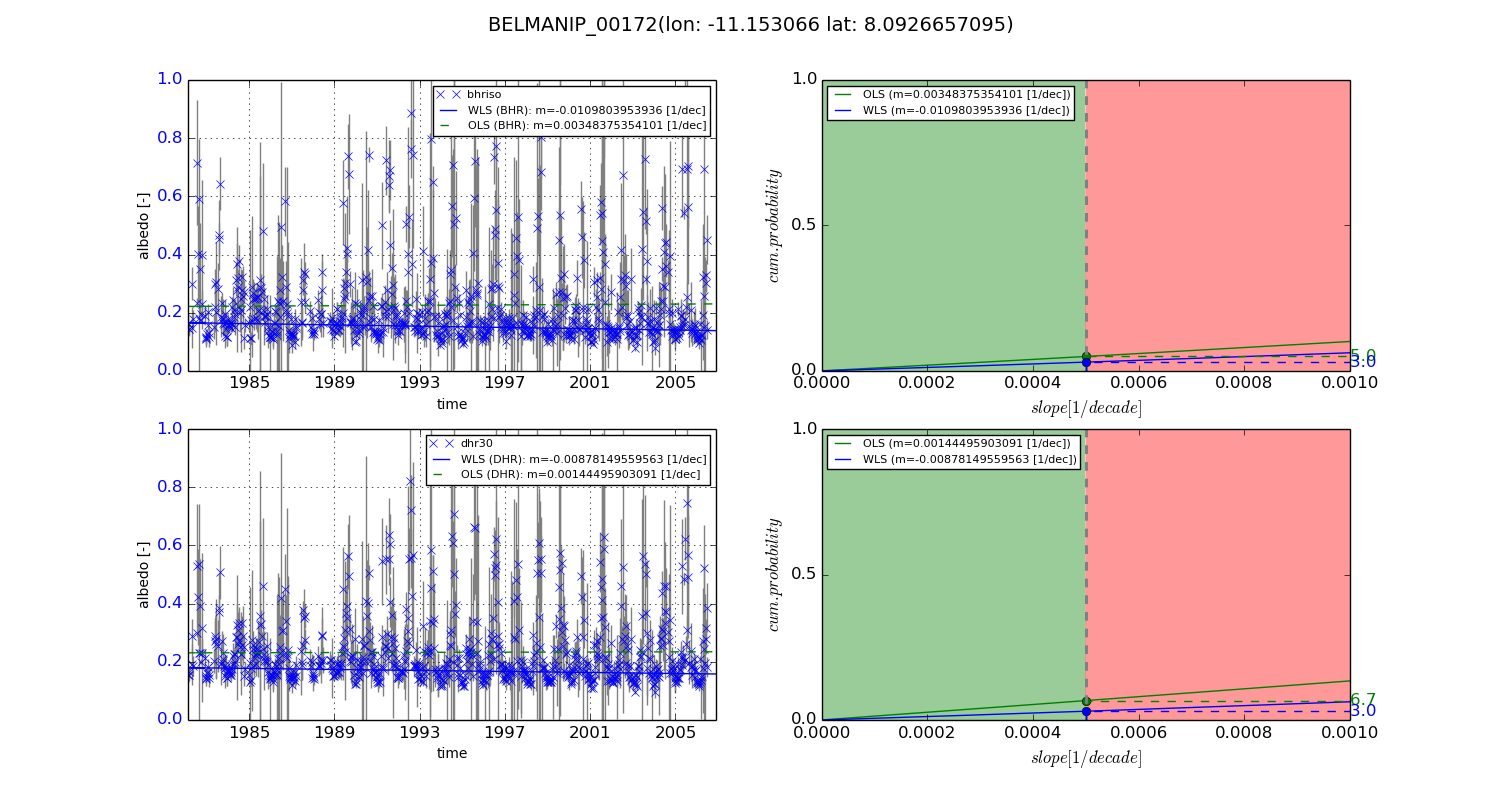
Temporal stability analysis

+000 deg (BHR)


BHR statistics

Temporal stability [1/decade]:


abs

rel


Weighted least square:

-0.0109803953936


Ordinary least square:

0.00348375354101


Probabilities that GCOS criteria is met:

Weighted least square:

3.0 %

Ordinary least square:

5.0 %


DHR statistics

Temporal stability [1/decade]:


abs

rel


Weighted least square:

-0.00878149559563


Ordinary least square:

0.00144495903091


Probabilities that GCOS criteria is met:

Weighted least square:

3.0 %

Ordinary least square:

6.7 %


+057/+063 deg (BHR)


BHR statistics

Temporal stability [1/decade]:


abs

rel


Weighted least square:

-99999.0


Ordinary least square:

-99999.0


Probabilities that GCOS criteria is met:

Weighted least square:

-99999.0 %

Ordinary least square:

-99999.0 %


DHR statistics

Temporal stability [1/decade]:


abs

rel


Weighted least square:

-99999.0


Ordinary least square:

-99999.0


Probabilities that GCOS criteria is met:

Weighted least square:

-99999.0 %

Ordinary least square:

-99999.0 %


Temporal anomaly analyis

The variance of the temporal anomalies provides an additional measure about the stability of the signal AFTER removal of the mean seasonal cylce.
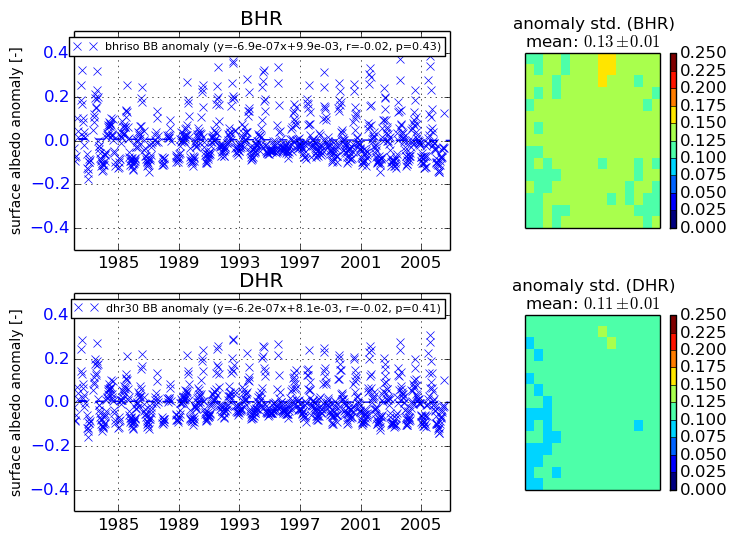
+000 deg


+057/+063 deg