BELMANIP_00173


Location

lon / lat [deg]: 32.8733 / 2.1074

Source network: BELMANIP


Geostationary surface albedo (GSA) data


“+000”


“+057/+063”


Landcover information (based on ESA CCI landcover data)


Landcover fractions @ 2km distance


Landcover fractions @ 20 km distance


Legend


Distance to open water bodies [km]:

23.08

Distance to urban areas [km]:

11.2


Radius: 1 km

Number of landcover classes:

1

Dominant landcover type:

10: cropland, rainfed

Fraction of dominant landcover type [%]:

100.0


Radius: 2 km

Number of landcover classes:

1

Dominant landcover type:

10: cropland, rainfed

Fraction of dominant landcover type [%]:

100.0


Radius: 5 km

Number of landcover classes:

1

Dominant landcover type:

10: cropland, rainfed

Fraction of dominant landcover type [%]:

100.0


Radius: 10 km

Number of landcover classes:

1

Dominant landcover type:

10: cropland, rainfed

Fraction of dominant landcover type [%]:

100.0


Radius: 20 km

Number of landcover classes:

2

Dominant landcover type:

10: cropland, rainfed

Fraction of dominant landcover type [%]:

99.0


Disturbances


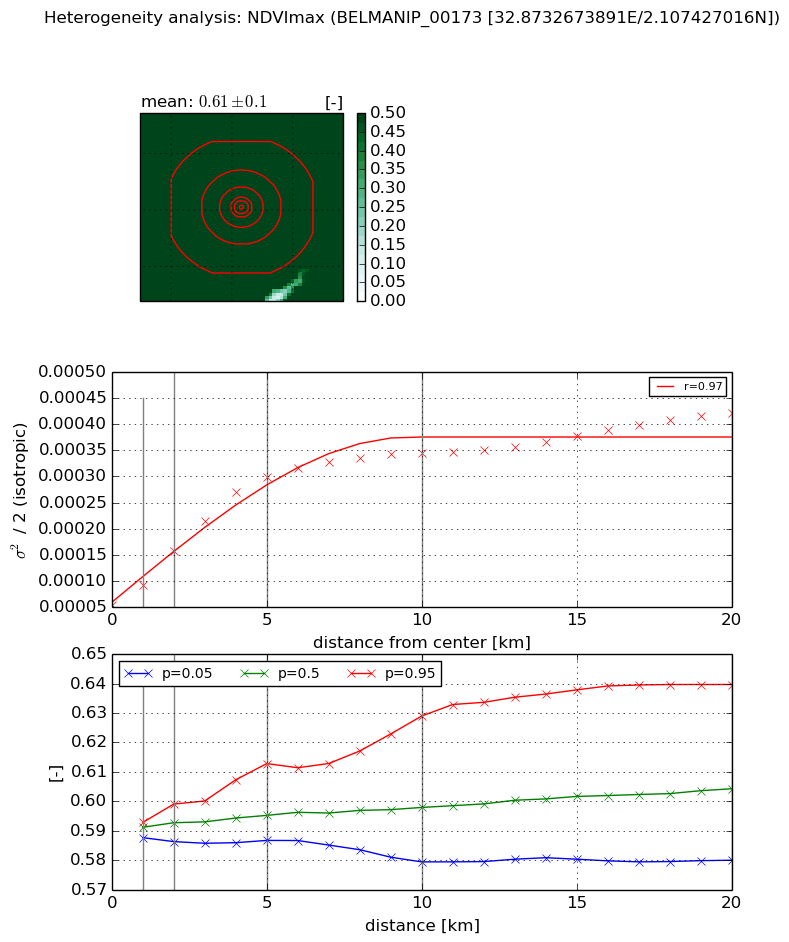
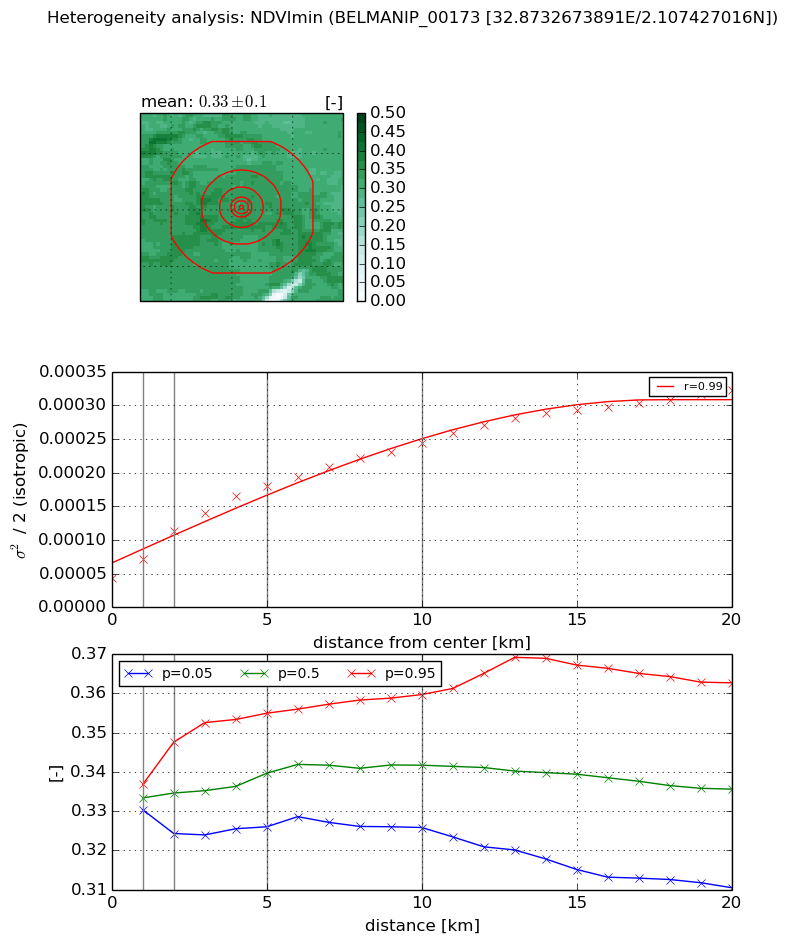
Heterogeneity analysis

The heterogeneity analysis provides information about the spatial and temporal heterogeneity of the site.

Topography


Roman et al. (2009) index


St

0.000982771368793

Rcv

0.0102173122891

Rse

0.0

Rst

-0.0212795158676

Rsv

3052.56048465


Height range @ 1km [m]

25

Height range @ 2km [m]

37

Height range @ 5km [m]

48

Height range @ 10km [m]

-999

Height range @ 20km [m]

-999


Variance slope @ 1 km

67

Variance slope @ 2 km

57

Variance slope @ 5 km

40

Variance slope @ 10 km

-999

Variance slope @ 20 km

-999


NDVI (max. NDVI composite)


Roman et al. (2009) index


St

nan

Rcv

nan

Rse

nan

Rst

nan

Rsv

nan


NDVI range @ 1km [-]

0.01

NDVI range @ 2km [-]

0.01

NDVI range @ 5km [-]

0.03

NDVI range @ 10km [-]

0.05

NDVI range @ 20km [-]

0.06


Variance slope @ 1 km

3.88773681412e-05

Variance slope @ 2 km

5.20474375679e-05

Variance slope @ 5 km

5.178559701e-05

Variance slope @ 10 km

2.96581115016e-05

Variance slope @ 20 km

1.46639426114e-05


NDVI (min. NDVI composite)I


Roman et al. (2009) index


St

22.7524746718

Rcv

-0.0326083920997

Rse

0.0

Rst

-0.0483193575258

Rsv

-0.0509260396117


NDVI range @ 1km [-]

0.01

NDVI range @ 2km [-]

0.02

NDVI range @ 5km [-]

0.03

NDVI range @ 10km [-]

0.03

NDVI range @ 20km [-]

0.05


NDVI slope @ 1 km

2.951942013e-05

NDVI slope @ 2 km

3.51206871613e-05

NDVI slope @ 5 km

2.82988423681e-05

NDVI slope @ 10 km

1.93846517601e-05

NDVI slope @ 20 km

1.27344756337e-05


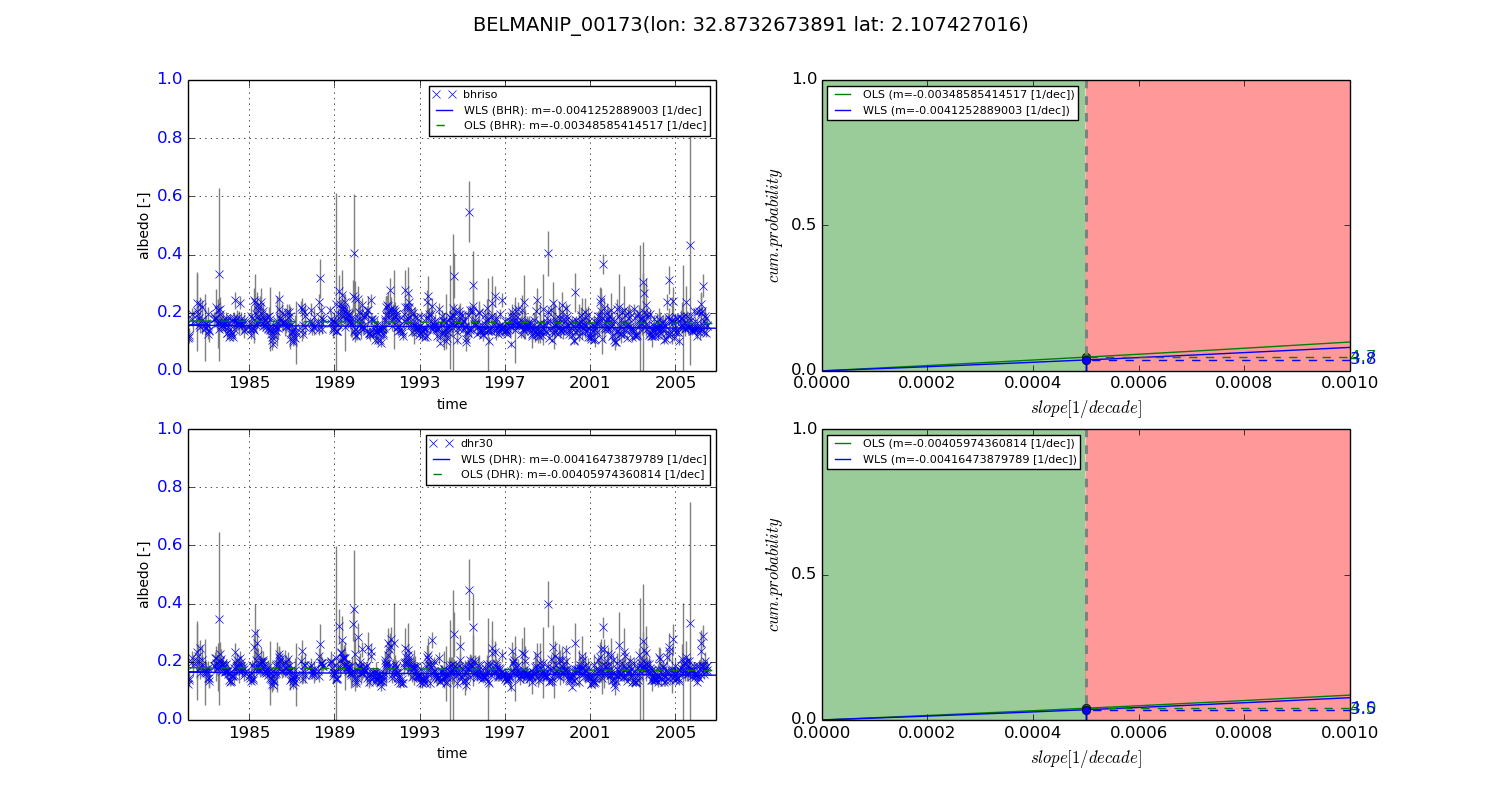
Temporal stability analysis

+000 deg (BHR)


BHR statistics

Temporal stability [1/decade]:


abs

rel


Weighted least square:

-0.0041252889003


Ordinary least square:

-0.00348585414517


Probabilities that GCOS criteria is met:

Weighted least square:

3.8 %

Ordinary least square:

4.7 %


DHR statistics

Temporal stability [1/decade]:


abs

rel


Weighted least square:

-0.00416473879789


Ordinary least square:

-0.00405974360814


Probabilities that GCOS criteria is met:

Weighted least square:

3.5 %

Ordinary least square:

4.0 %


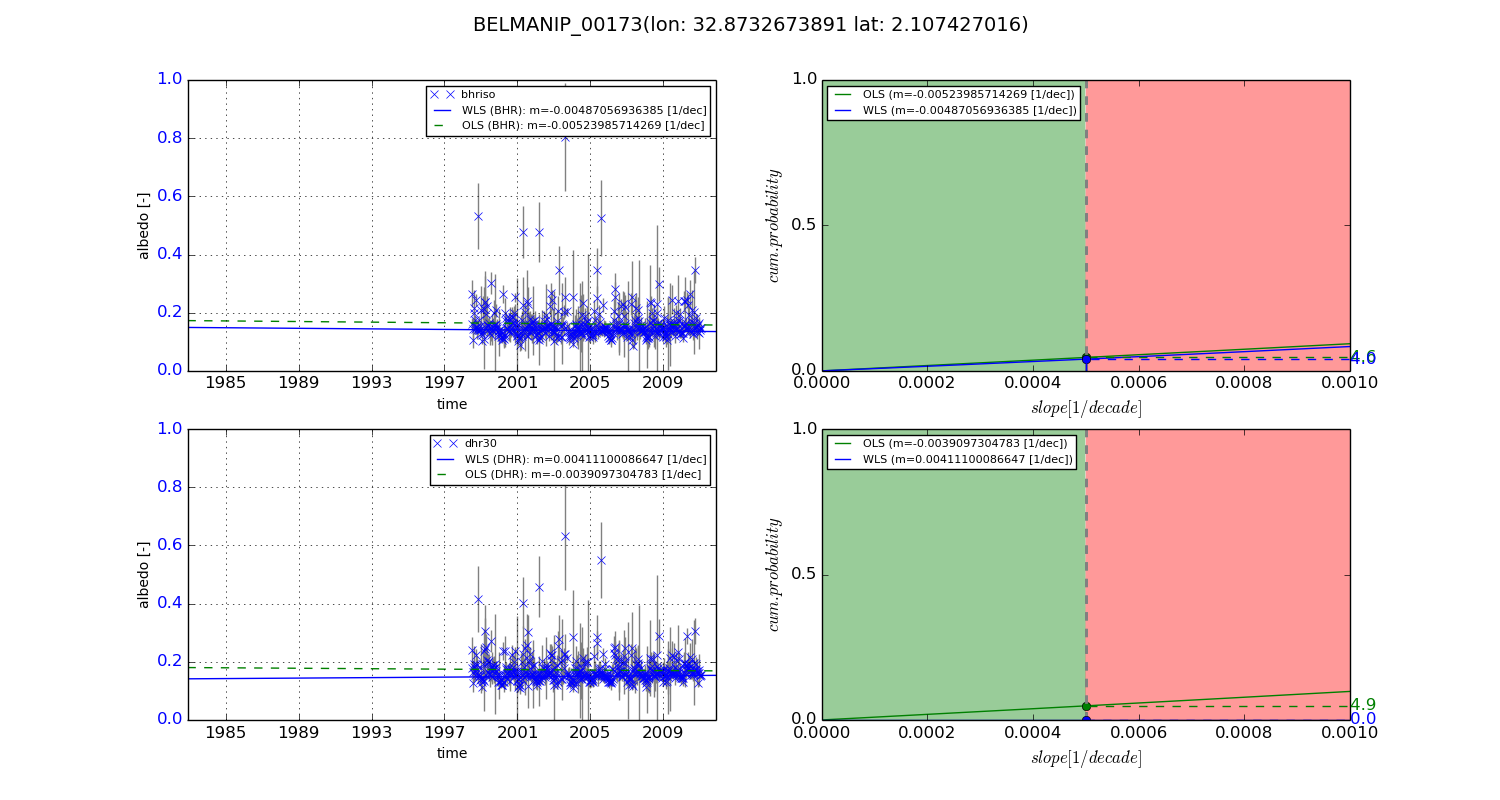
+057/+063 deg (BHR)


BHR statistics

Temporal stability [1/decade]:


abs

rel


Weighted least square:

-0.00487056936385


Ordinary least square:

-0.00523985714269


Probabilities that GCOS criteria is met:

Weighted least square:

4.0 %

Ordinary least square:

4.6 %


DHR statistics

Temporal stability [1/decade]:


abs

rel


Weighted least square:

0.00411100086647


Ordinary least square:

-0.0039097304783


Probabilities that GCOS criteria is met:

Weighted least square:

0.0 %

Ordinary least square:

4.9 %


Temporal anomaly analyis

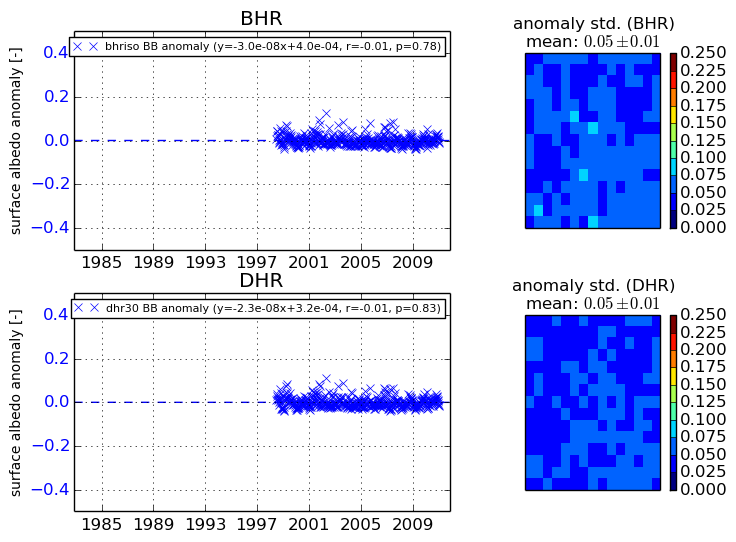
The variance of the temporal anomalies provides an additional measure about the stability of the signal AFTER removal of the mean seasonal cylce.
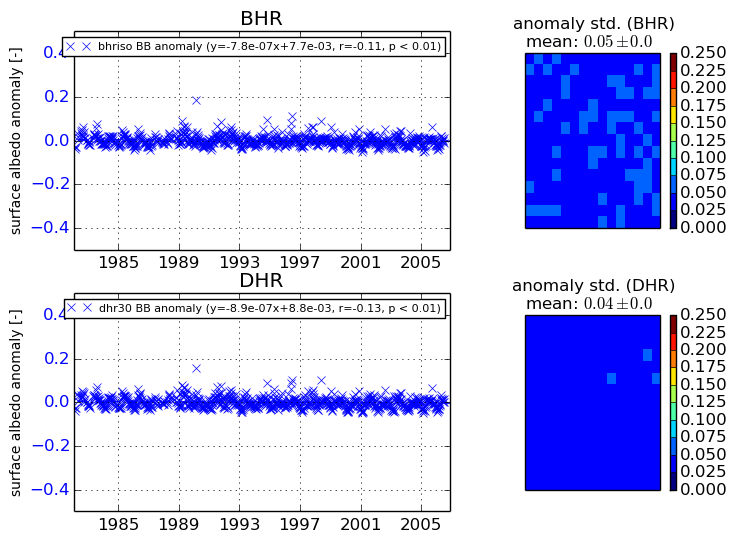
+000 deg


+057/+063 deg