BELMANIP_00174


Location

lon / lat [deg]: 10.1127 / 8.8764

Source network: BELMANIP


Geostationary surface albedo (GSA) data


“+000”


“+057/+063”


Landcover information (based on ESA CCI landcover data)


Landcover fractions @ 2km distance


Landcover fractions @ 20 km distance


Legend


Distance to open water bodies [km]:

27.38

Distance to urban areas [km]:

28.6


Radius: 1 km

Number of landcover classes:

3

Dominant landcover type:

120: Shrubland

Fraction of dominant landcover type [%]:

51.0


Radius: 2 km

Number of landcover classes:

5

Dominant landcover type:

120: Shrubland

Fraction of dominant landcover type [%]:

47.0


Radius: 5 km

Number of landcover classes:

5

Dominant landcover type:

120: Shrubland

Fraction of dominant landcover type [%]:

35.0


Radius: 10 km

Number of landcover classes:

5

Dominant landcover type:

120: Shrubland

Fraction of dominant landcover type [%]:

39.0


Radius: 20 km

Number of landcover classes:

5

Dominant landcover type:

120: Shrubland

Fraction of dominant landcover type [%]:

31.0


Disturbances


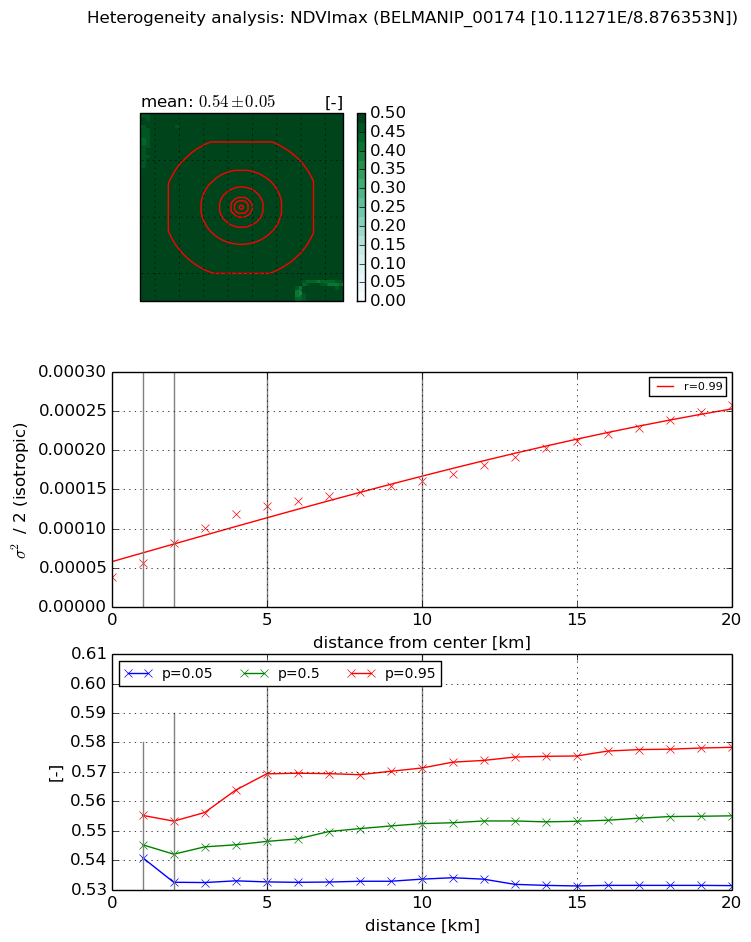
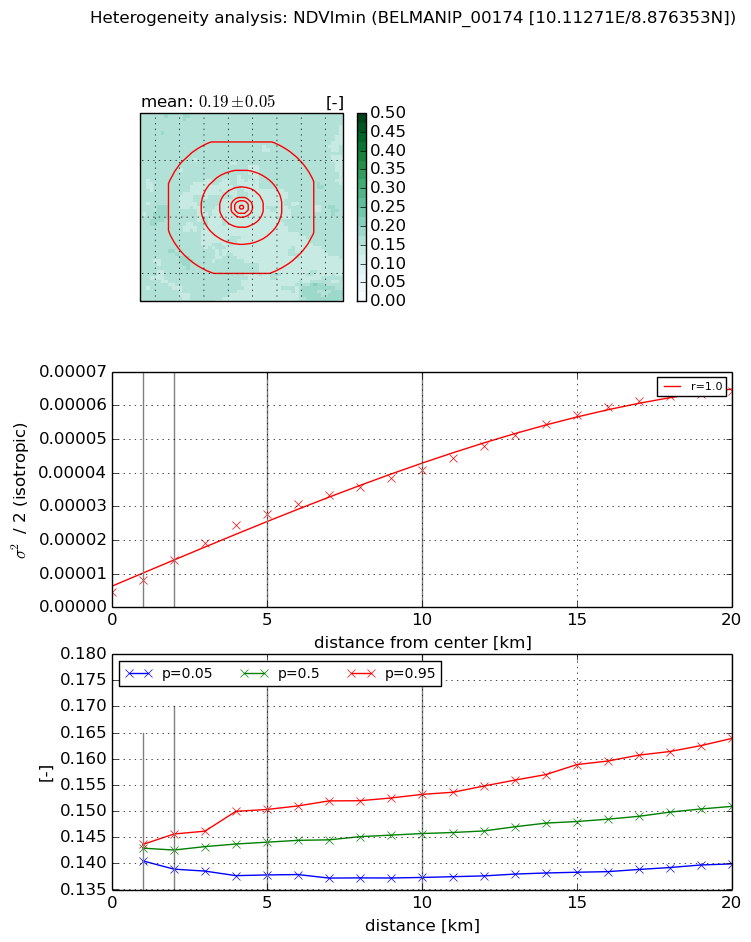
Heterogeneity analysis

The heterogeneity analysis provides information about the spatial and temporal heterogeneity of the site.

Topography


Roman et al. (2009) index


St

0.0017124037883

Rcv

0.293181077701

Rse

0.0

Rst

0.0557261789986

Rsv

1751.57433683


Height range @ 1km [m]

14

Height range @ 2km [m]

22

Height range @ 5km [m]

34

Height range @ 10km [m]

-999

Height range @ 20km [m]

-999


Variance slope @ 1 km

18

Variance slope @ 2 km

25

Variance slope @ 5 km

25

Variance slope @ 10 km

-999

Variance slope @ 20 km

-999


NDVI (max. NDVI composite)


Roman et al. (2009) index


St

1.80004405792

Rcv

0.377703212268

Rse

0.0

Rst

-0.288922909119

Rsv

-0.999999751908


NDVI range @ 1km [-]

0.01

NDVI range @ 2km [-]

0.02

NDVI range @ 5km [-]

0.04

NDVI range @ 10km [-]

0.04

NDVI range @ 20km [-]

0.05


Variance slope @ 1 km

1.80377568562e-05

Variance slope @ 2 km

2.18565117556e-05

Variance slope @ 5 km

1.88391472263e-05

Variance slope @ 10 km

1.17519533752e-05

Variance slope @ 20 km

9.87168848334e-06


NDVI (min. NDVI composite)I


Roman et al. (2009) index


St

1.18972782239

Rcv

0.36063733852

Rse

0.0

Rst

-0.352244627804

Rsv

1.80870317571


NDVI range @ 1km [-]

0.0

NDVI range @ 2km [-]

0.01

NDVI range @ 5km [-]

0.01

NDVI range @ 10km [-]

0.02

NDVI range @ 20km [-]

0.02


NDVI slope @ 1 km

3.7085599048e-06

NDVI slope @ 2 km

4.89027728264e-06

NDVI slope @ 5 km

4.86685400142e-06

NDVI slope @ 10 km

3.65472470781e-06

NDVI slope @ 20 km

3.01446885895e-06


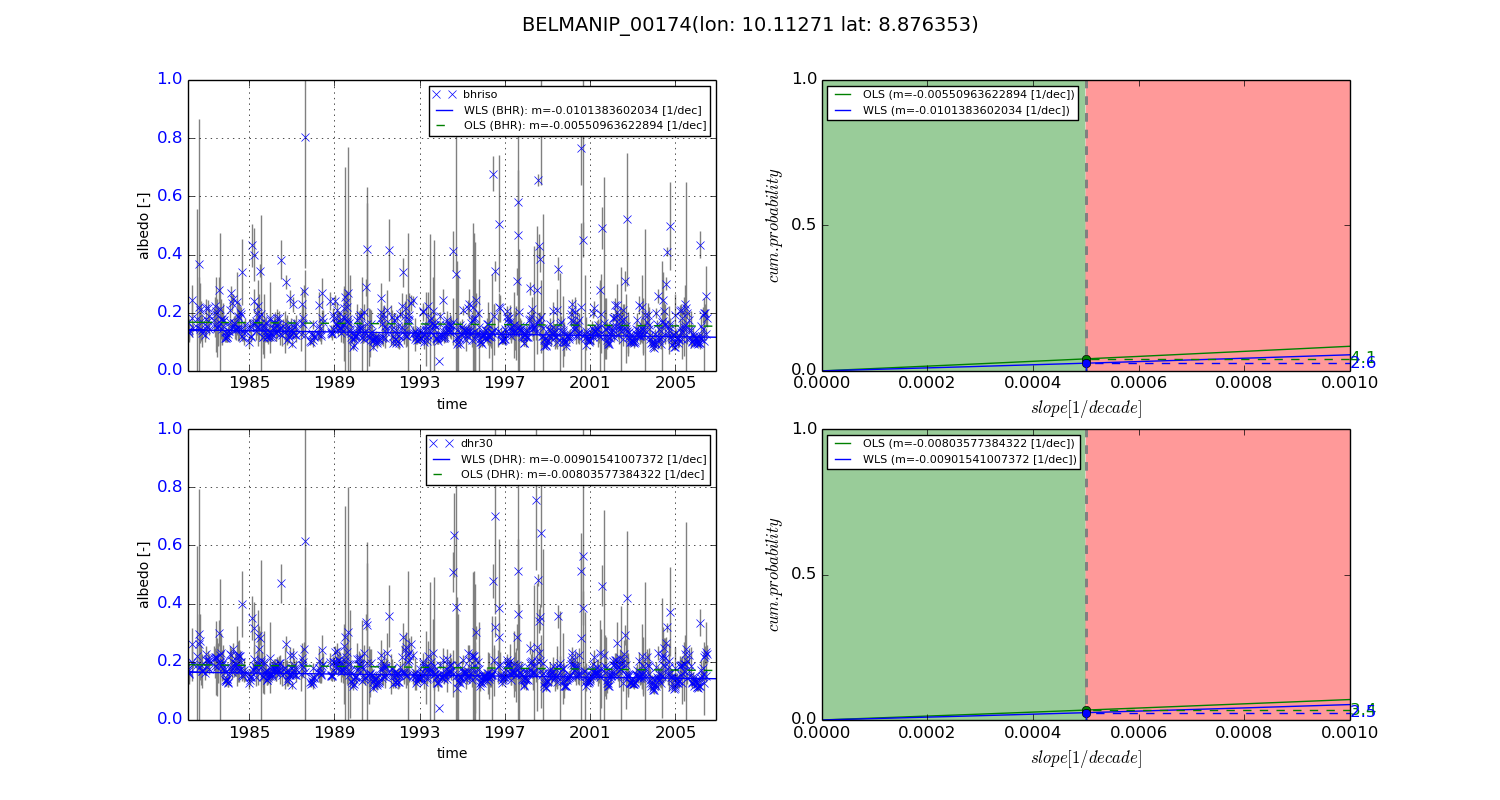
Temporal stability analysis

+000 deg (BHR)


BHR statistics

Temporal stability [1/decade]:


abs

rel


Weighted least square:

-0.0101383602034


Ordinary least square:

-0.00550963622894


Probabilities that GCOS criteria is met:

Weighted least square:

2.6 %

Ordinary least square:

4.1 %


DHR statistics

Temporal stability [1/decade]:


abs

rel


Weighted least square:

-0.00901541007372


Ordinary least square:

-0.00803577384322


Probabilities that GCOS criteria is met:

Weighted least square:

2.5 %

Ordinary least square:

3.4 %


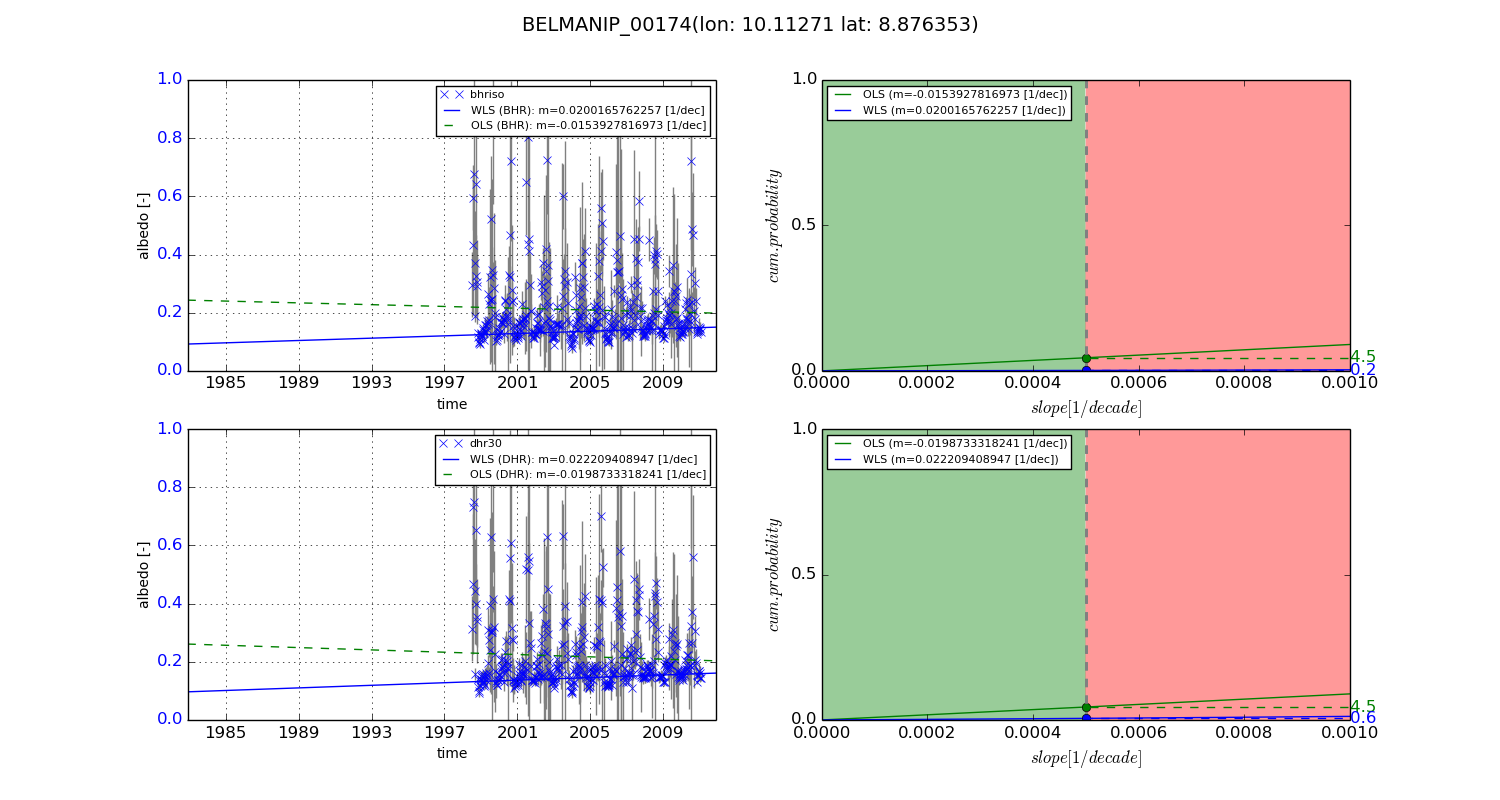
+057/+063 deg (BHR)


BHR statistics

Temporal stability [1/decade]:


abs

rel


Weighted least square:

0.0200165762257


Ordinary least square:

-0.0153927816973


Probabilities that GCOS criteria is met:

Weighted least square:

0.2 %

Ordinary least square:

4.5 %


DHR statistics

Temporal stability [1/decade]:


abs

rel


Weighted least square:

0.022209408947


Ordinary least square:

-0.0198733318241


Probabilities that GCOS criteria is met:

Weighted least square:

0.6 %

Ordinary least square:

4.5 %


Temporal anomaly analyis

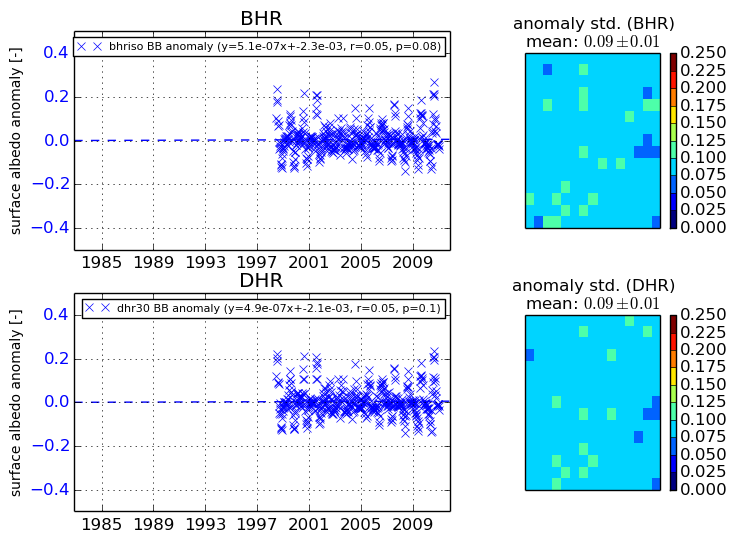
The variance of the temporal anomalies provides an additional measure about the stability of the signal AFTER removal of the mean seasonal cylce.
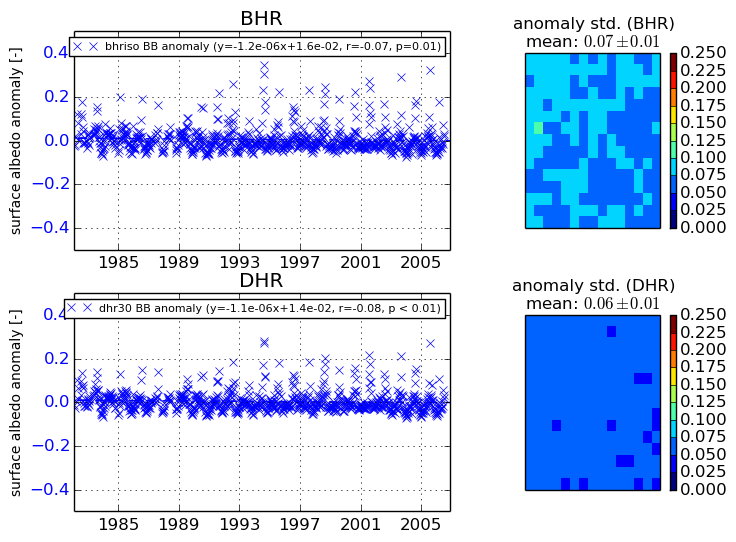
+000 deg


+057/+063 deg