BELMANIP_00175


Location

lon / lat [deg]: -8.9862 / 10.498

Source network: BELMANIP


Geostationary surface albedo (GSA) data


“+000”


“+057/+063”


Landcover information (based on ESA CCI landcover data)


Landcover fractions @ 2km distance


Landcover fractions @ 20 km distance


Legend


Distance to open water bodies [km]:

23.78

Distance to urban areas [km]:

33.87


Radius: 1 km

Number of landcover classes:

2

Dominant landcover type:

120: Shrubland

Fraction of dominant landcover type [%]:

91.0


Radius: 2 km

Number of landcover classes:

2

Dominant landcover type:

120: Shrubland

Fraction of dominant landcover type [%]:

94.0


Radius: 5 km

Number of landcover classes:

2

Dominant landcover type:

120: Shrubland

Fraction of dominant landcover type [%]:

96.0


Radius: 10 km

Number of landcover classes:

3

Dominant landcover type:

120: Shrubland

Fraction of dominant landcover type [%]:

90.0


Radius: 20 km

Number of landcover classes:

3

Dominant landcover type:

120: Shrubland

Fraction of dominant landcover type [%]:

91.0


Disturbances


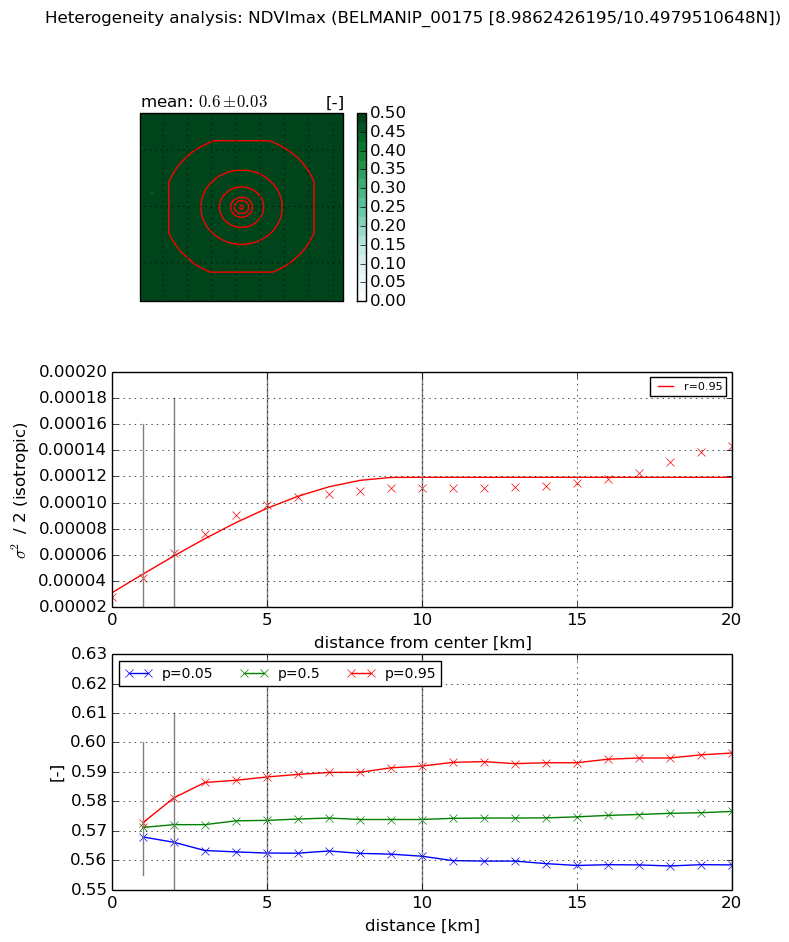
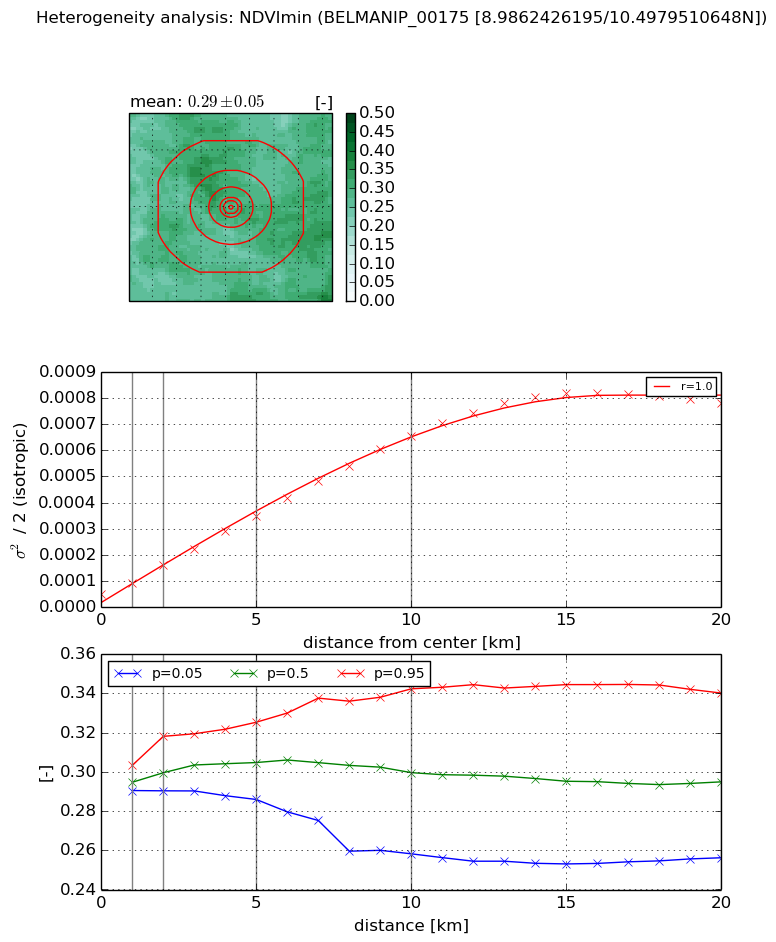
Heterogeneity analysis

The heterogeneity analysis provides information about the spatial and temporal heterogeneity of the site.

Topography


Roman et al. (2009) index


St

2.965592618

Rcv

0.145370045495

Rse

0.0

Rst

-0.155425711078

Rsv

0.710806437805


Height range @ 1km [m]

41

Height range @ 2km [m]

48

Height range @ 5km [m]

57

Height range @ 10km [m]

-999

Height range @ 20km [m]

-999


Variance slope @ 1 km

211

Variance slope @ 2 km

122

Variance slope @ 5 km

51

Variance slope @ 10 km

-999

Variance slope @ 20 km

-999


NDVI (max. NDVI composite)


Roman et al. (2009) index


St

nan

Rcv

nan

Rse

nan

Rst

nan

Rsv

nan


NDVI range @ 1km [-]

0.0

NDVI range @ 2km [-]

0.02

NDVI range @ 5km [-]

0.03

NDVI range @ 10km [-]

0.03

NDVI range @ 20km [-]

0.04


Variance slope @ 1 km

1.39052472539e-05

Variance slope @ 2 km

1.67934307951e-05

Variance slope @ 5 km

1.45553401822e-05

Variance slope @ 10 km

8.2760070058e-06

Variance slope @ 20 km

4.17065585381e-06


NDVI (min. NDVI composite)I


Roman et al. (2009) index


St

2.19927395692

Rcv

0.287805112135

Rse

0.0

Rst

-0.257025424456

Rsv

0.819256002315


NDVI range @ 1km [-]

0.01

NDVI range @ 2km [-]

0.03

NDVI range @ 5km [-]

0.04

NDVI range @ 10km [-]

0.08

NDVI range @ 20km [-]

0.08


NDVI slope @ 1 km

4.31704679647e-05

NDVI slope @ 2 km

5.67117433048e-05

NDVI slope @ 5 km

6.12556022082e-05

NDVI slope @ 10 km

6.22500826466e-05

NDVI slope @ 20 km

4.07974704474e-05


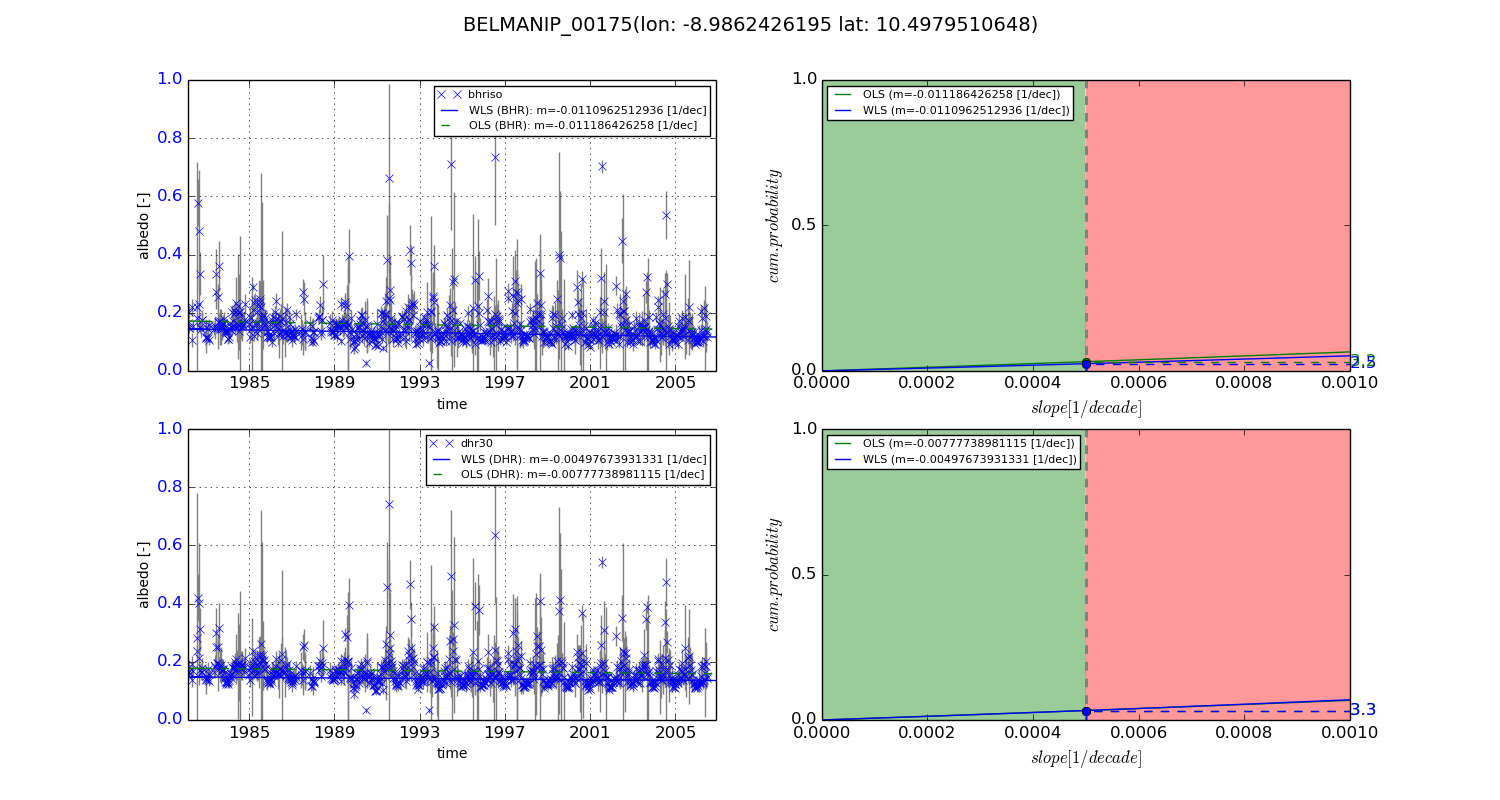
Temporal stability analysis

+000 deg (BHR)


BHR statistics

Temporal stability [1/decade]:


abs

rel


Weighted least square:

-0.0110962512936


Ordinary least square:

-0.011186426258


Probabilities that GCOS criteria is met:

Weighted least square:

2.5 %

Ordinary least square:

3.2 %


DHR statistics

Temporal stability [1/decade]:


abs

rel


Weighted least square:

-0.00497673931331


Ordinary least square:

-0.00777738981115


Probabilities that GCOS criteria is met:

Weighted least square:

3.3 %

Ordinary least square:

3.3 %


+057/+063 deg (BHR)


BHR statistics

Temporal stability [1/decade]:


abs

rel


Weighted least square:

-99999.0


Ordinary least square:

-99999.0


Probabilities that GCOS criteria is met:

Weighted least square:

-99999.0 %

Ordinary least square:

-99999.0 %


DHR statistics

Temporal stability [1/decade]:


abs

rel


Weighted least square:

-99999.0


Ordinary least square:

-99999.0


Probabilities that GCOS criteria is met:

Weighted least square:

-99999.0 %

Ordinary least square:

-99999.0 %


Temporal anomaly analyis

The variance of the temporal anomalies provides an additional measure about the stability of the signal AFTER removal of the mean seasonal cylce.
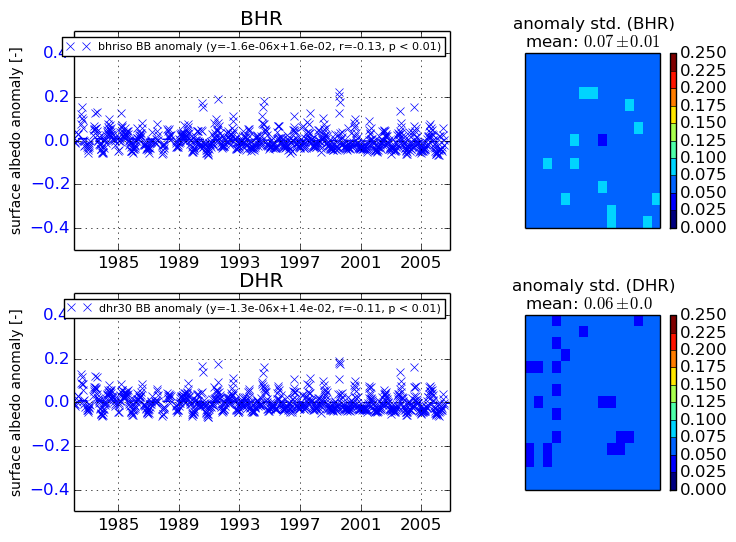
+000 deg


+057/+063 deg