BELMANIP_00177


Location

lon / lat [deg]: -10.7606 / 16.2652

Source network: BELMANIP


Geostationary surface albedo (GSA) data


“+000”


“+057/+063”


Landcover information (based on ESA CCI landcover data)


Landcover fractions @ 2km distance


Landcover fractions @ 20 km distance


Legend


Distance to open water bodies [km]:

70.11

Distance to urban areas [km]:

none in region


Radius: 1 km

Number of landcover classes:

1

Dominant landcover type:

130: grassland

Fraction of dominant landcover type [%]:

100.0


Radius: 2 km

Number of landcover classes:

2

Dominant landcover type:

130: grassland

Fraction of dominant landcover type [%]:

85.0


Radius: 5 km

Number of landcover classes:

3

Dominant landcover type:

130: grassland

Fraction of dominant landcover type [%]:

77.0


Radius: 10 km

Number of landcover classes:

5

Dominant landcover type:

130: grassland

Fraction of dominant landcover type [%]:

80.0


Radius: 20 km

Number of landcover classes:

4

Dominant landcover type:

130: grassland

Fraction of dominant landcover type [%]:

85.0


Disturbances


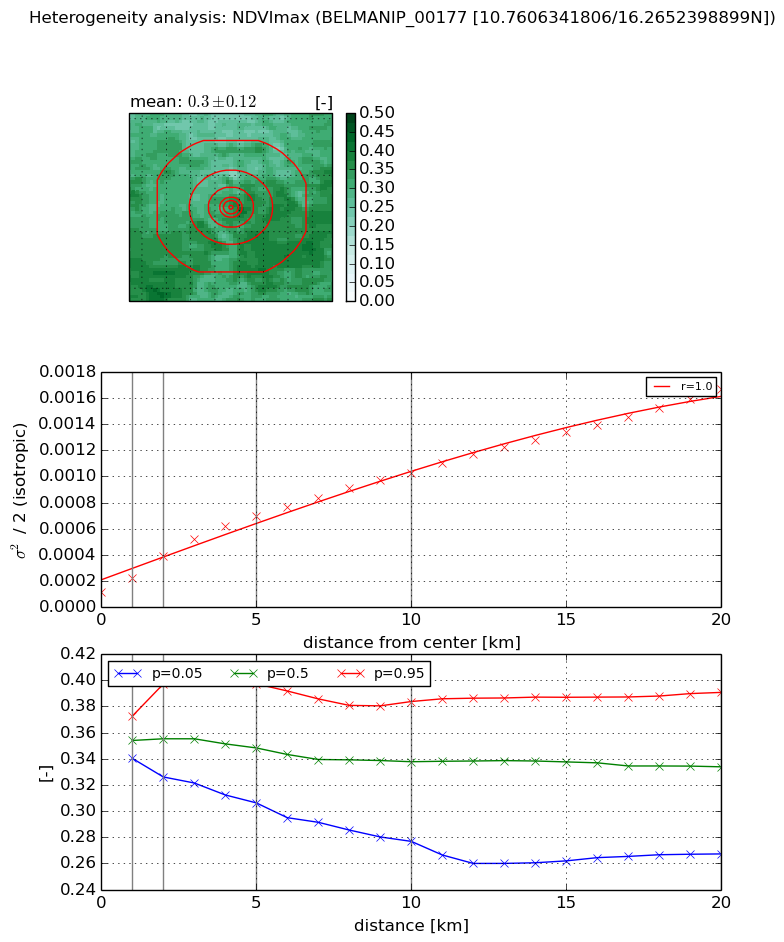
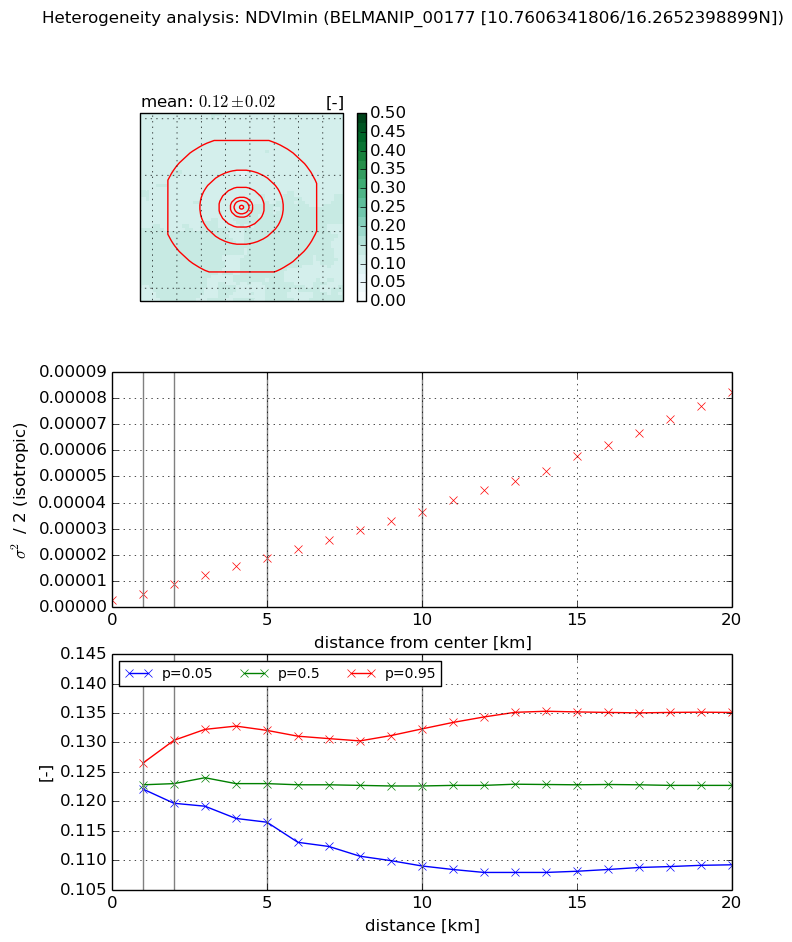
Heterogeneity analysis

The heterogeneity analysis provides information about the spatial and temporal heterogeneity of the site.

Topography


Roman et al. (2009) index


St

9.16262982598

Rcv

0.111455385692

Rse

0.0

Rst

-0.0469581870696

Rsv

0.16900334323


Height range @ 1km [m]

15

Height range @ 2km [m]

25

Height range @ 5km [m]

33

Height range @ 10km [m]

-999

Height range @ 20km [m]

-999


Variance slope @ 1 km

46

Variance slope @ 2 km

46

Variance slope @ 5 km

35

Variance slope @ 10 km

-999

Variance slope @ 20 km

-999


NDVI (max. NDVI composite)


Roman et al. (2009) index


St

4.5151292639

Rcv

0.0158782784776

Rse

0.0

Rst

0.101880910465

Rsv

0.54667361567


NDVI range @ 1km [-]

0.03

NDVI range @ 2km [-]

0.07

NDVI range @ 5km [-]

0.09

NDVI range @ 10km [-]

0.11

NDVI range @ 20km [-]

0.12


Variance slope @ 1 km

0.000104808431073

Variance slope @ 2 km

0.000136298642594

Variance slope @ 5 km

0.000120589328637

Variance slope @ 10 km

8.97214177947e-05

Variance slope @ 20 km

7.1622764378e-05


NDVI (min. NDVI composite)I


Roman et al. (2009) index


St

1.70888359366e-07

Rcv

0.132321128206

Rse

0.0

Rst

0.217371301292

Rsv

17555320.6279


NDVI range @ 1km [-]

0.0

NDVI range @ 2km [-]

0.01

NDVI range @ 5km [-]

0.02

NDVI range @ 10km [-]

0.02

NDVI range @ 20km [-]

0.03


NDVI slope @ 1 km

2.37309801222e-06

NDVI slope @ 2 km

3.13676091969e-06

NDVI slope @ 5 km

3.31694032984e-06

NDVI slope @ 10 km

3.40450841835e-06

NDVI slope @ 20 km

3.9297714847e-06


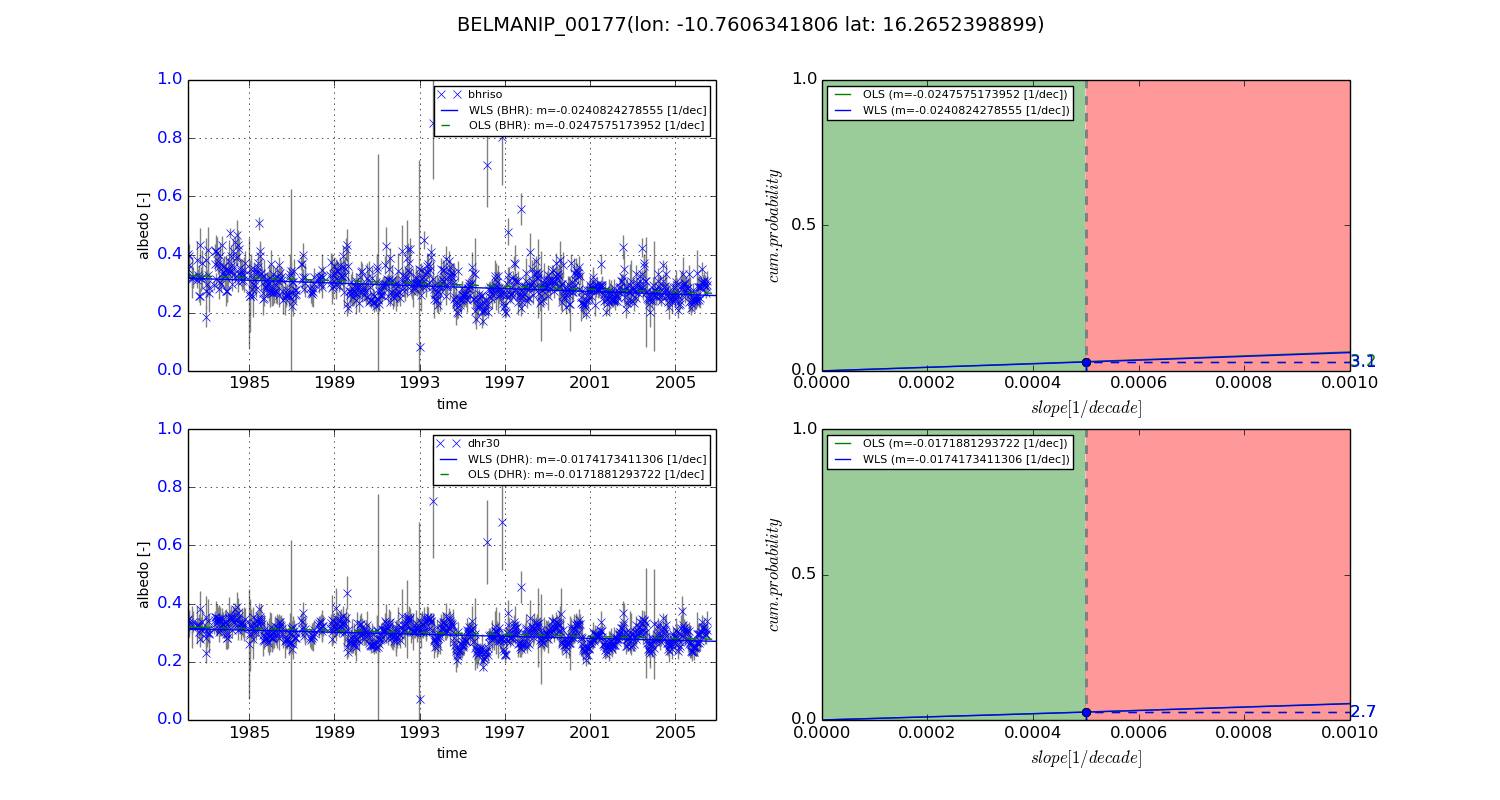
Temporal stability analysis

+000 deg (BHR)


BHR statistics

Temporal stability [1/decade]:


abs

rel


Weighted least square:

-0.0240824278555


Ordinary least square:

-0.0247575173952


Probabilities that GCOS criteria is met:

Weighted least square:

3.1 %

Ordinary least square:

3.2 %


DHR statistics

Temporal stability [1/decade]:


abs

rel


Weighted least square:

-0.0174173411306


Ordinary least square:

-0.0171881293722


Probabilities that GCOS criteria is met:

Weighted least square:

2.7 %

Ordinary least square:

2.7 %


+057/+063 deg (BHR)


BHR statistics

Temporal stability [1/decade]:


abs

rel


Weighted least square:

-99999.0


Ordinary least square:

-99999.0


Probabilities that GCOS criteria is met:

Weighted least square:

-99999.0 %

Ordinary least square:

-99999.0 %


DHR statistics

Temporal stability [1/decade]:


abs

rel


Weighted least square:

-99999.0


Ordinary least square:

-99999.0


Probabilities that GCOS criteria is met:

Weighted least square:

-99999.0 %

Ordinary least square:

-99999.0 %


Temporal anomaly analyis

The variance of the temporal anomalies provides an additional measure about the stability of the signal AFTER removal of the mean seasonal cylce.
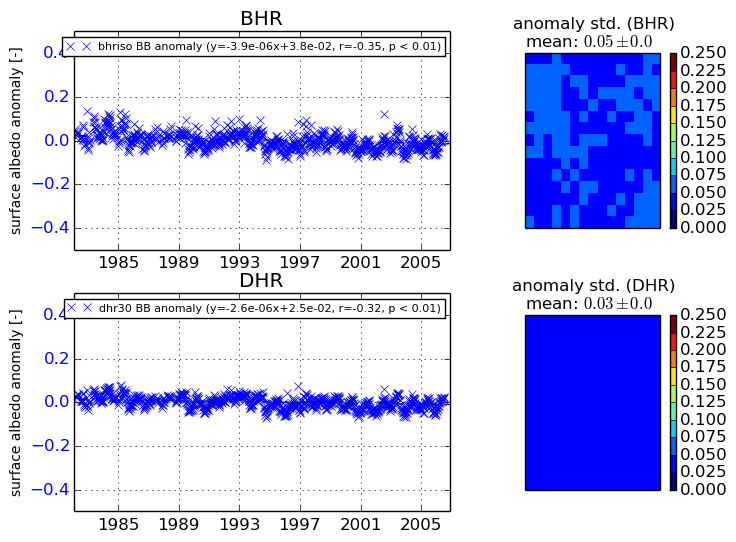
+000 deg


+057/+063 deg