BELMANIP_00178


Location

lon / lat [deg]: 9.2416 / 12.8954

Source network: BELMANIP


Geostationary surface albedo (GSA) data


“+000”


“+057/+063”


Landcover information (based on ESA CCI landcover data)


Landcover fractions @ 2km distance


Landcover fractions @ 20 km distance


Legend


Distance to open water bodies [km]:

none in region

Distance to urban areas [km]:

10.72


Radius: 1 km

Number of landcover classes:

1

Dominant landcover type:

10: cropland, rainfed

Fraction of dominant landcover type [%]:

100.0


Radius: 2 km

Number of landcover classes:

1

Dominant landcover type:

10: cropland, rainfed

Fraction of dominant landcover type [%]:

100.0


Radius: 5 km

Number of landcover classes:

1

Dominant landcover type:

10: cropland, rainfed

Fraction of dominant landcover type [%]:

100.0


Radius: 10 km

Number of landcover classes:

1

Dominant landcover type:

10: cropland, rainfed

Fraction of dominant landcover type [%]:

99.0


Radius: 20 km

Number of landcover classes:

1

Dominant landcover type:

10: cropland, rainfed

Fraction of dominant landcover type [%]:

99.0


Disturbances


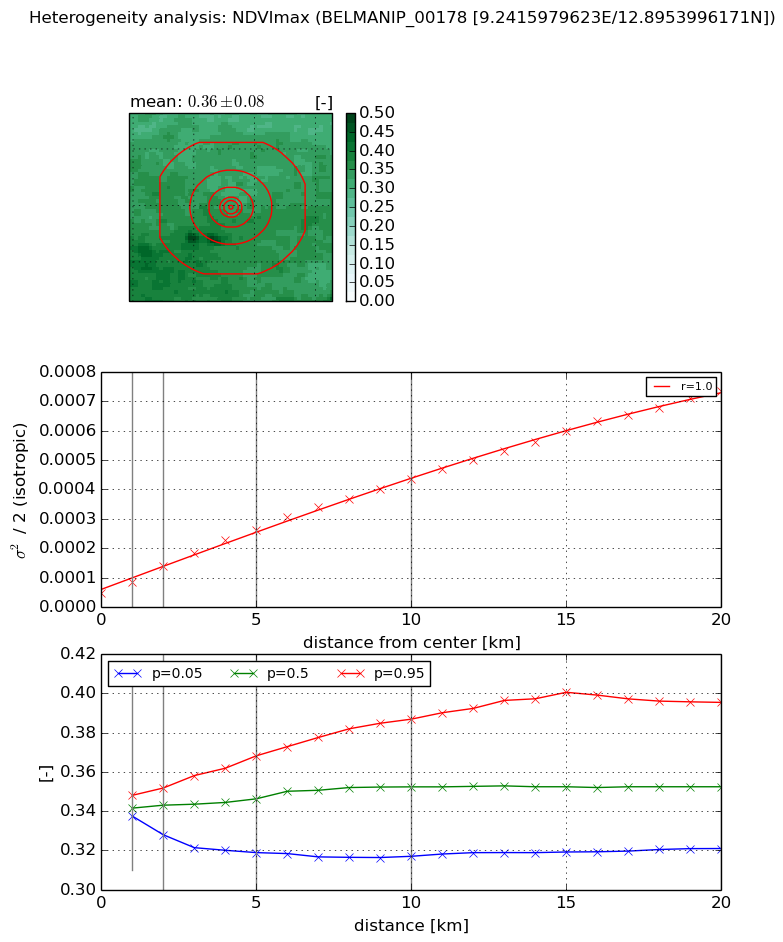
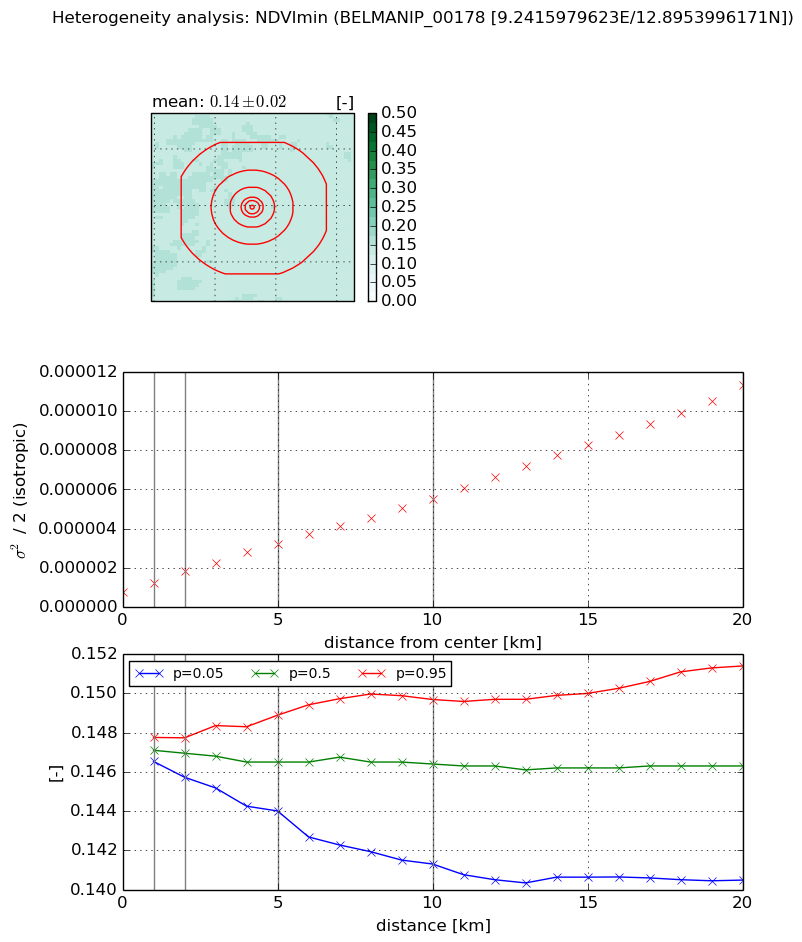
Heterogeneity analysis

The heterogeneity analysis provides information about the spatial and temporal heterogeneity of the site.

Topography


Roman et al. (2009) index


St

2.88470826244

Rcv

0.0744940590675

Rse

0.0

Rst

1.22730847234e-05

Rsv

-0.965460183375


Height range @ 1km [m]

6

Height range @ 2km [m]

5

Height range @ 5km [m]

6

Height range @ 10km [m]

-999

Height range @ 20km [m]

-999


Variance slope @ 1 km

0

Variance slope @ 2 km

0

Variance slope @ 5 km

0

Variance slope @ 10 km

-999

Variance slope @ 20 km

-999


NDVI (max. NDVI composite)


Roman et al. (2009) index


St

1.4828440685

Rcv

0.448404793749

Rse

0.0

Rst

-0.574736031556

Rsv

-0.999998399999


NDVI range @ 1km [-]

0.01

NDVI range @ 2km [-]

0.02

NDVI range @ 5km [-]

0.05

NDVI range @ 10km [-]

0.07

NDVI range @ 20km [-]

0.07


Variance slope @ 1 km

3.7302552159e-05

Variance slope @ 2 km

4.69298725024e-05

Variance slope @ 5 km

4.44509501706e-05

Variance slope @ 10 km

3.88948240698e-05

Variance slope @ 20 km

3.39366445064e-05


NDVI (min. NDVI composite)I


Roman et al. (2009) index


St

3.60132789581

Rcv

0.507823558497

Rse

0.0

Rst

-3.17446682373e-08

Rsv

0.325202473142


NDVI range @ 1km [-]

0.0

NDVI range @ 2km [-]

0.0

NDVI range @ 5km [-]

0.0

NDVI range @ 10km [-]

0.01

NDVI range @ 20km [-]

0.01


NDVI slope @ 1 km

4.73035442234e-07

NDVI slope @ 2 km

5.3128361821e-07

NDVI slope @ 5 km

5.00230401147e-07

NDVI slope @ 10 km

4.71713785898e-07

NDVI slope @ 20 km

5.13242431743e-07


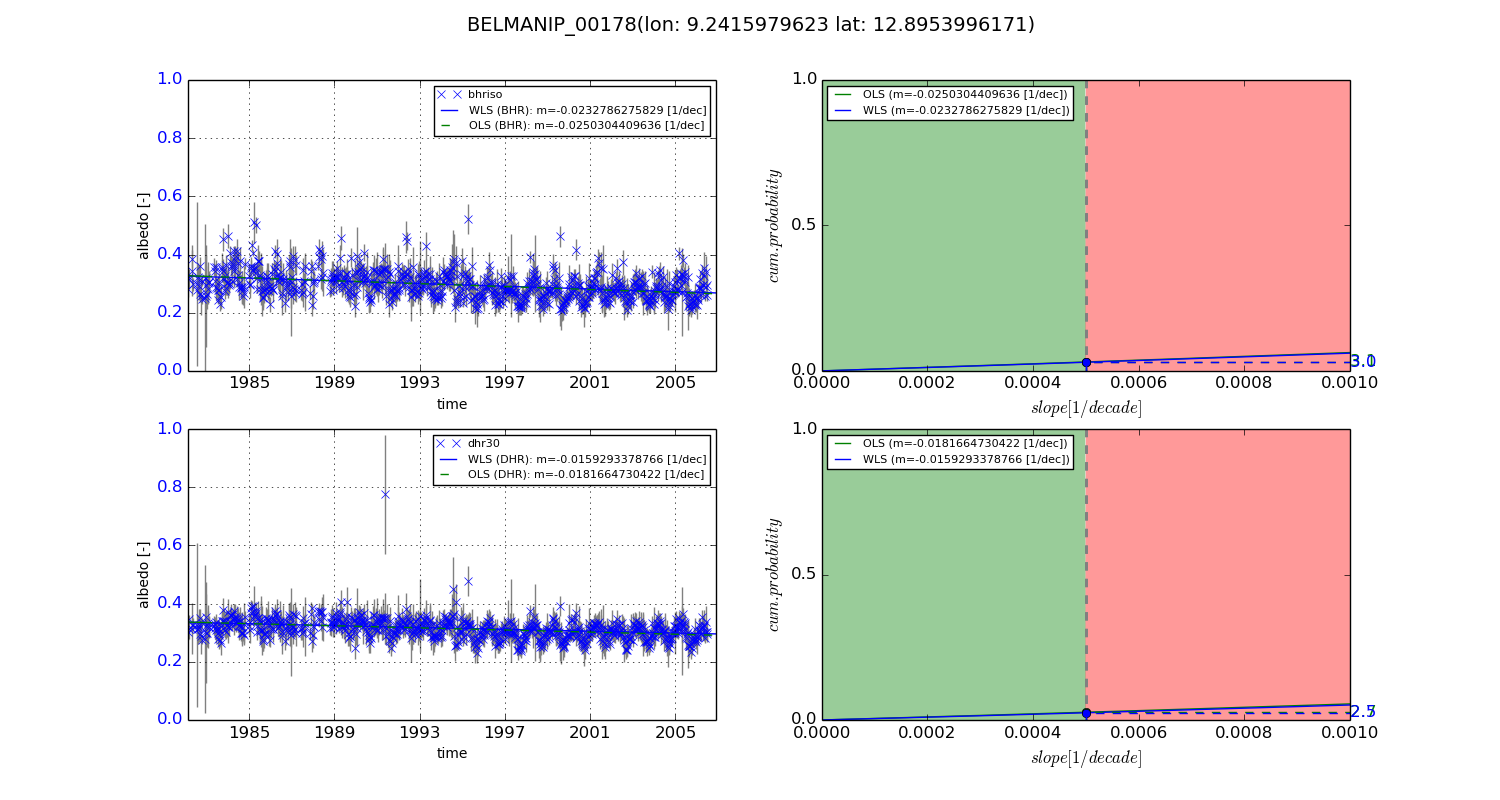
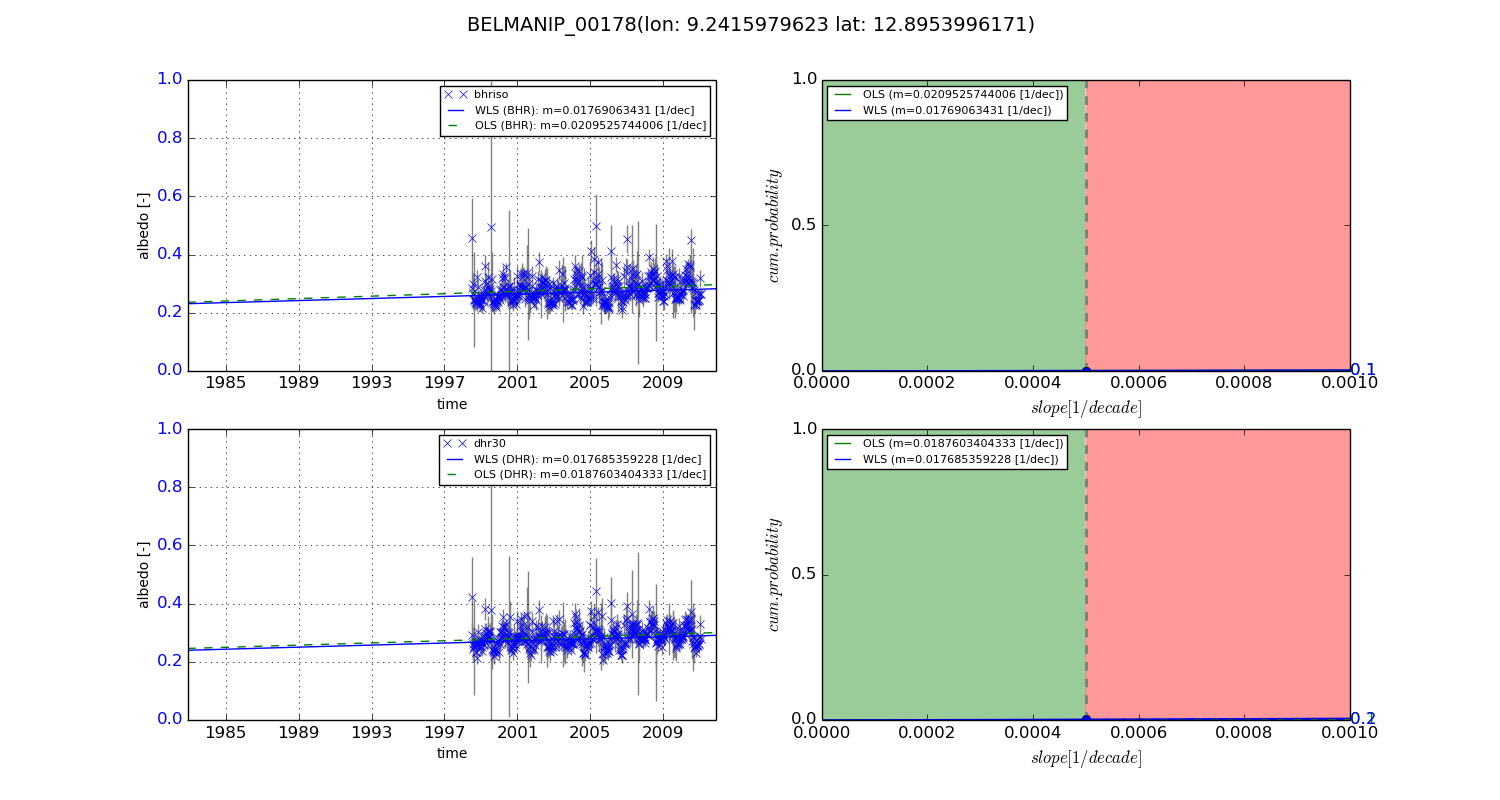
Temporal stability analysis

+000 deg (BHR)


BHR statistics

Temporal stability [1/decade]:


abs

rel


Weighted least square:

-0.0232786275829


Ordinary least square:

-0.0250304409636


Probabilities that GCOS criteria is met:

Weighted least square:

3.0 %

Ordinary least square:

3.1 %


DHR statistics

Temporal stability [1/decade]:


abs

rel


Weighted least square:

-0.0159293378766


Ordinary least square:

-0.0181664730422


Probabilities that GCOS criteria is met:

Weighted least square:

2.5 %

Ordinary least square:

2.7 %


+057/+063 deg (BHR)


BHR statistics

Temporal stability [1/decade]:


abs

rel


Weighted least square:

0.01769063431


Ordinary least square:

0.0209525744006


Probabilities that GCOS criteria is met:

Weighted least square:

0.1 %

Ordinary least square:

0.1 %


DHR statistics

Temporal stability [1/decade]:


abs

rel


Weighted least square:

0.017685359228


Ordinary least square:

0.0187603404333


Probabilities that GCOS criteria is met:

Weighted least square:

0.2 %

Ordinary least square:

0.1 %


Temporal anomaly analyis

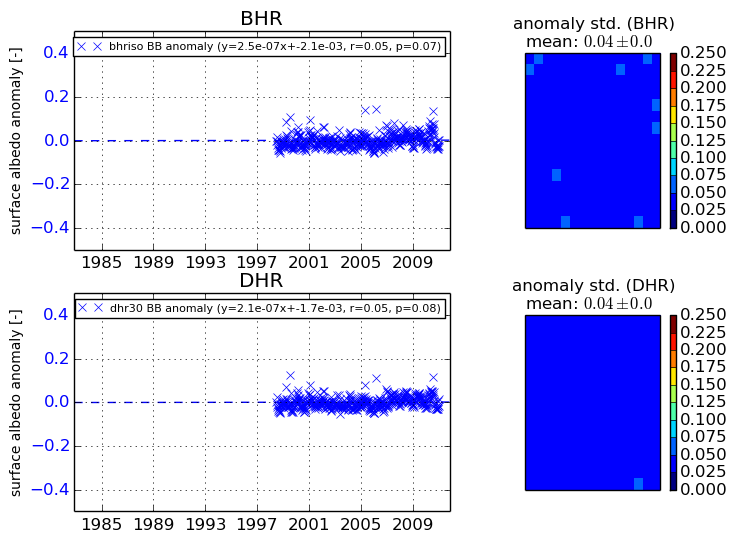
The variance of the temporal anomalies provides an additional measure about the stability of the signal AFTER removal of the mean seasonal cylce.
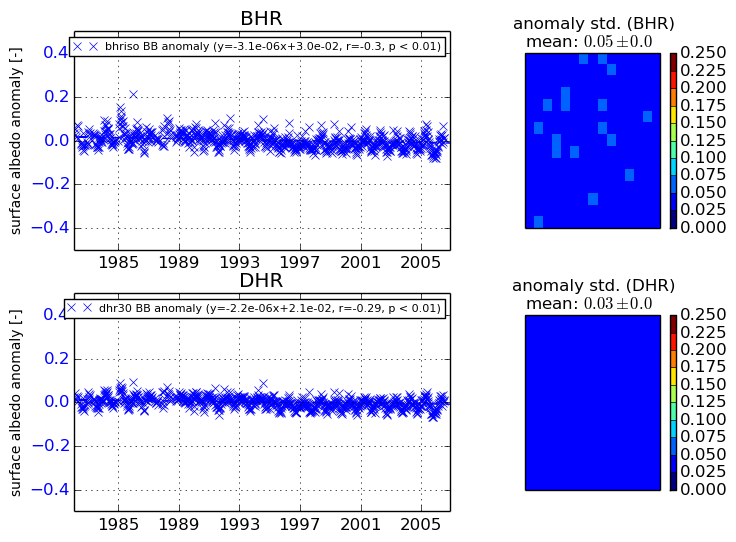
+000 deg


+057/+063 deg