BELMANIP_00179


Location

lon / lat [deg]: 28.7599 / 12.3254

Source network: BELMANIP


Geostationary surface albedo (GSA) data


“+000”


“+057/+063”


Landcover information (based on ESA CCI landcover data)


Landcover fractions @ 2km distance


Landcover fractions @ 20 km distance


Legend


Distance to open water bodies [km]:

34.42

Distance to urban areas [km]:

29.23


Radius: 1 km

Number of landcover classes:

2

Dominant landcover type:

10: cropland, rainfed

Fraction of dominant landcover type [%]:

82.0


Radius: 2 km

Number of landcover classes:

3

Dominant landcover type:

10: cropland, rainfed

Fraction of dominant landcover type [%]:

79.0


Radius: 5 km

Number of landcover classes:

2

Dominant landcover type:

10: cropland, rainfed

Fraction of dominant landcover type [%]:

90.0


Radius: 10 km

Number of landcover classes:

2

Dominant landcover type:

10: cropland, rainfed

Fraction of dominant landcover type [%]:

89.0


Radius: 20 km

Number of landcover classes:

4

Dominant landcover type:

10: cropland, rainfed

Fraction of dominant landcover type [%]:

78.0


Disturbances


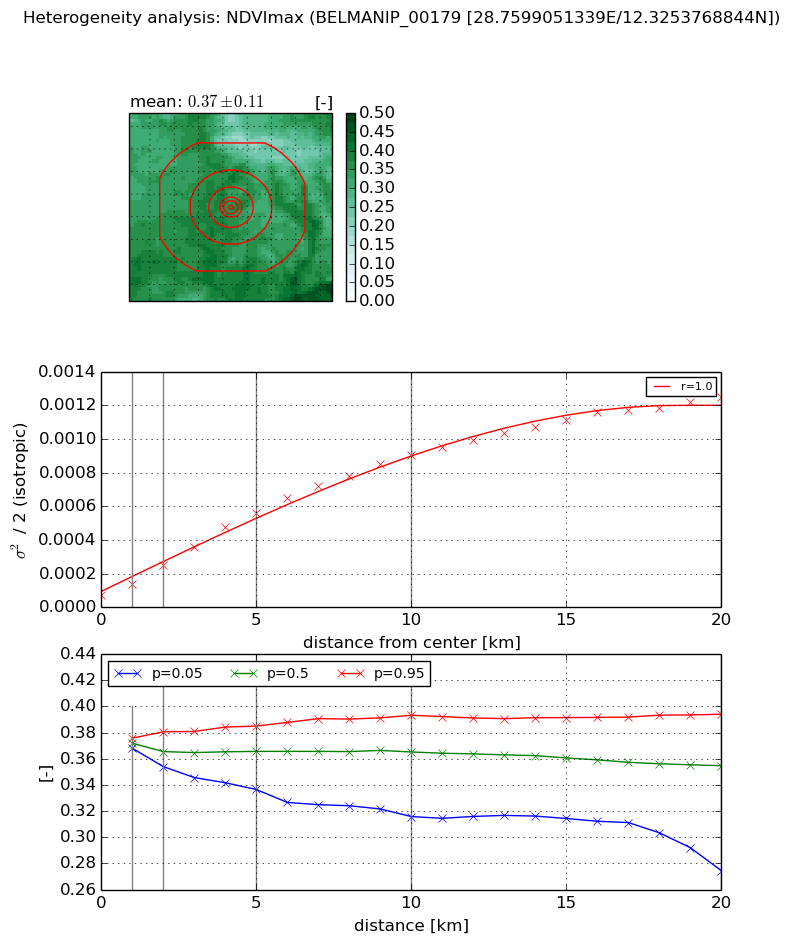
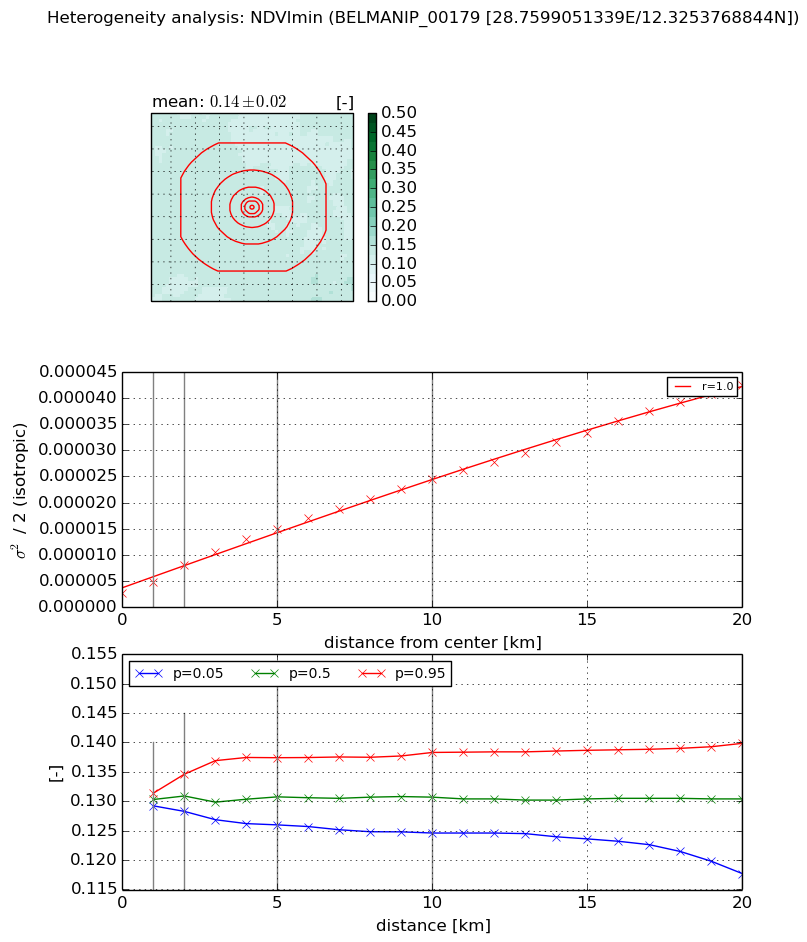
Heterogeneity analysis

The heterogeneity analysis provides information about the spatial and temporal heterogeneity of the site.

Topography


Roman et al. (2009) index


St

0.931044476828

Rcv

0.2469984948

Rse

0.0

Rst

0.0151760044579

Rsv

2.96001313481


Height range @ 1km [m]

14

Height range @ 2km [m]

21

Height range @ 5km [m]

30

Height range @ 10km [m]

-999

Height range @ 20km [m]

-999


Variance slope @ 1 km

17

Variance slope @ 2 km

21

Variance slope @ 5 km

16

Variance slope @ 10 km

-999

Variance slope @ 20 km

-999


NDVI (max. NDVI composite)


Roman et al. (2009) index


St

0.398339424443

Rcv

0.420624999201

Rse

0.0

Rst

6.11064076596

Rsv

-0.999999823712


NDVI range @ 1km [-]

0.01

NDVI range @ 2km [-]

0.03

NDVI range @ 5km [-]

0.05

NDVI range @ 10km [-]

0.08

NDVI range @ 20km [-]

0.12


Variance slope @ 1 km

6.64524035316e-05

Variance slope @ 2 km

8.9396753111e-05

Variance slope @ 5 km

0.000101680665742

Variance slope @ 10 km

8.62625966639e-05

Variance slope @ 20 km

5.80572722496e-05


NDVI (min. NDVI composite)I


Roman et al. (2009) index


St

nan

Rcv

nan

Rse

nan

Rst

nan

Rsv

nan


NDVI range @ 1km [-]

0.0

NDVI range @ 2km [-]

0.01

NDVI range @ 5km [-]

0.01

NDVI range @ 10km [-]

0.01

NDVI range @ 20km [-]

0.02


NDVI slope @ 1 km

2.11521679173e-06

NDVI slope @ 2 km

2.62212118972e-06

NDVI slope @ 5 km

2.51876139459e-06

NDVI slope @ 10 km

2.16576014004e-06

NDVI slope @ 20 km

1.94185669928e-06


Temporal stability analysis

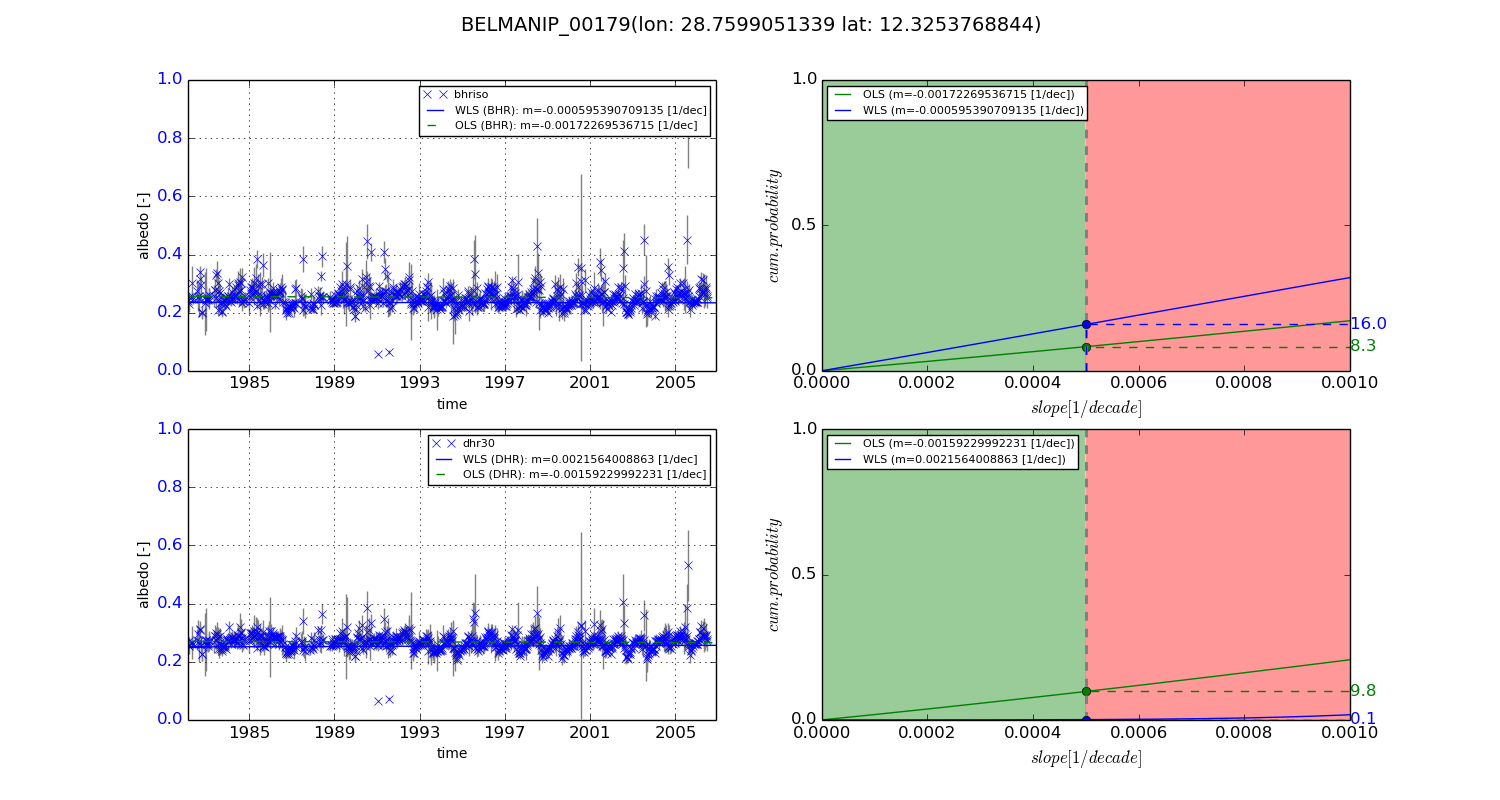
+000 deg (BHR)


BHR statistics

Temporal stability [1/decade]:


abs

rel


Weighted least square:

-0.000595390709135


Ordinary least square:

-0.00172269536715


Probabilities that GCOS criteria is met:

Weighted least square:

16.0 %

Ordinary least square:

8.3 %


DHR statistics

Temporal stability [1/decade]:


abs

rel


Weighted least square:

0.0021564008863


Ordinary least square:

-0.00159229992231


Probabilities that GCOS criteria is met:

Weighted least square:

0.1 %

Ordinary least square:

9.8 %


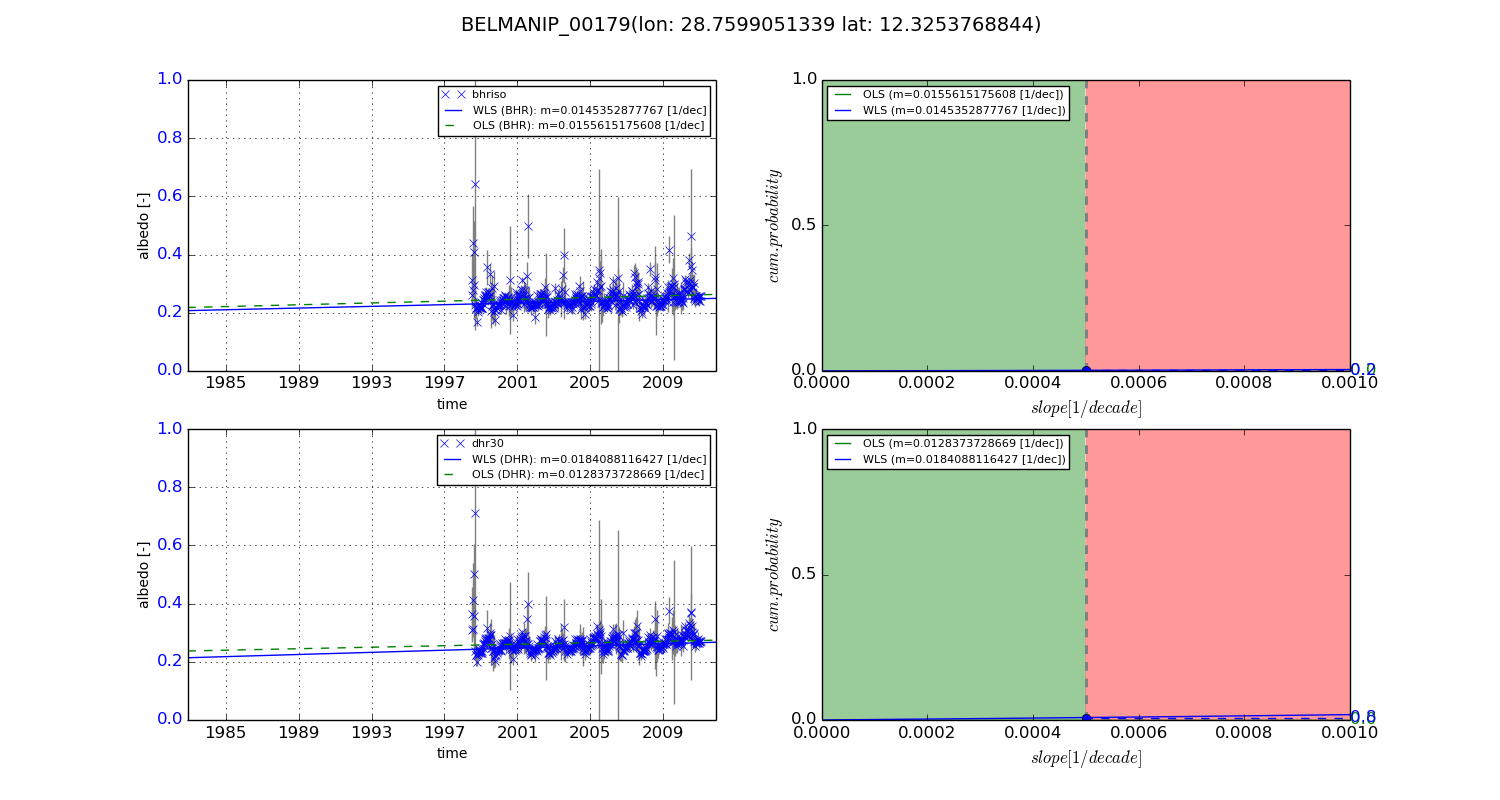
+057/+063 deg (BHR)


BHR statistics

Temporal stability [1/decade]:


abs

rel


Weighted least square:

0.0145352877767


Ordinary least square:

0.0155615175608


Probabilities that GCOS criteria is met:

Weighted least square:

0.2 %

Ordinary least square:

0.0 %


DHR statistics

Temporal stability [1/decade]:


abs

rel


Weighted least square:

0.0184088116427


Ordinary least square:

0.0128373728669


Probabilities that GCOS criteria is met:

Weighted least square:

0.8 %

Ordinary least square:

0.0 %


Temporal anomaly analyis

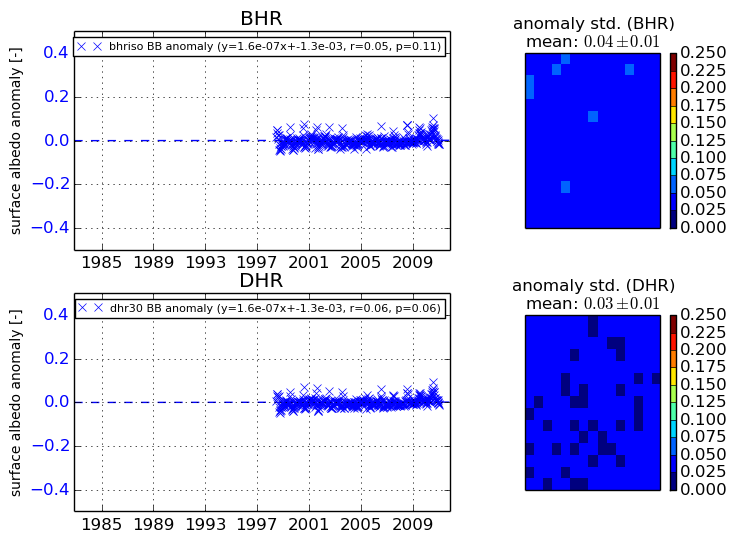
The variance of the temporal anomalies provides an additional measure about the stability of the signal AFTER removal of the mean seasonal cylce.
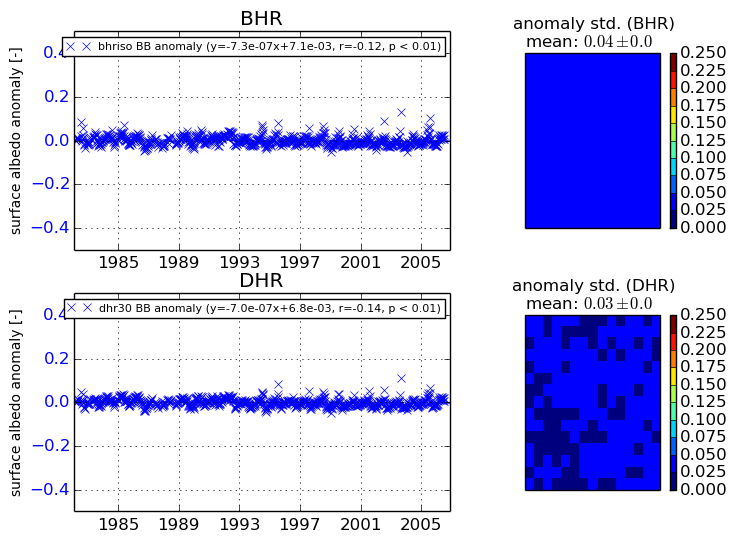
+000 deg


+057/+063 deg